


XAUUSD Today: Gold Catches Its Breath as the Fed Comes Into View

Vantage Editorial Team >
Vantage Editorial Team >
Vantage is a global, multi-asset broker with a team of in-house writers and market analysts who produce educational and insightful trading content for traders of all levels.
 Updated Fri, 2026 July 24 02:23
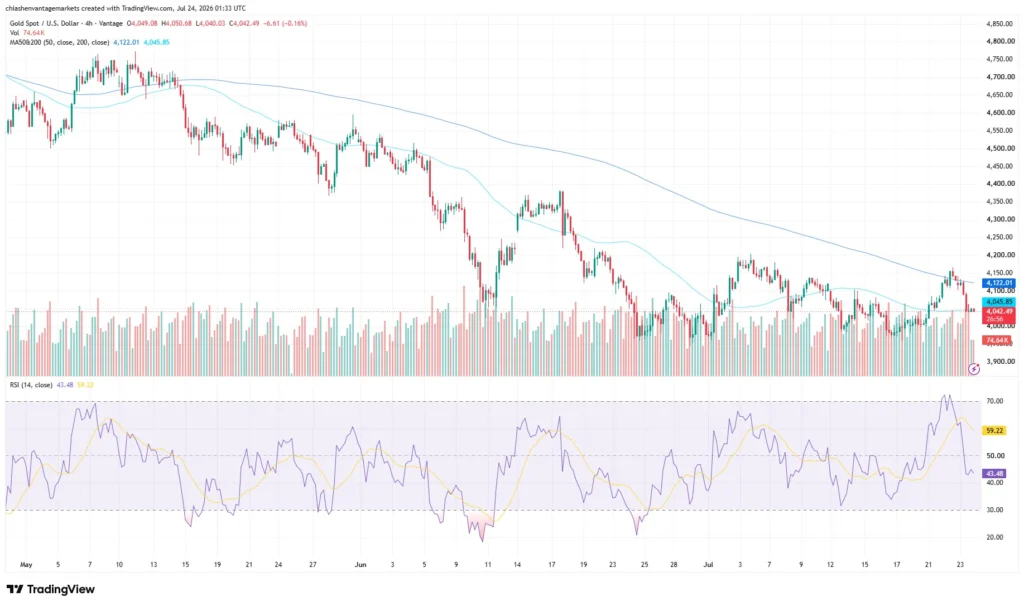
Gold is having a quiet Friday, and after the week it just had, that is a story in itself. The Vantage XAUUSD CFD trades near 4,042.49 as of the chart pulled at 01:33 UTC (09:33 GMT+8) on 24 July 2026, per the XAUUSD TradingView setup used for this analysis.[1]
In XAUUSD news terms, this is the third straight pullback since gold’s push toward 4,140 earlier this week, and it reads more like a breather than a reversal: the XAUUSD price still sits well clear of last week’s low near 3,960.
This XAUUSD technical analysis reads the gold price today and the gold price news behind it; it does not call where gold goes next.
Key points
- The XAUUSD price trades near 4,042.49 as of 24 July 2026, pulling back from a high near 4,140 reached earlier this week.
- The 200-period moving average sits at 4,045.85 and the 50-period average at 4,122.01, both above the current print, per the TradingView setup used for this analysis.
- The RSI (14) stands at 43.48, below its RSI moving average at 59.22, indicating that short-term momentum has weakened after this week’s rally.
XAUUSD chart: what today’s price action is showing
Friday’s session on the Vantage XAUUSD CFD feed has been almost sleepy compared with the whiplash seen earlier in the week. Gold opened at 4,049.08, ranged between 4,040.03 and 4,050.68, and last traded at 4,042.49, down 6.61 points, or 0.16%, on volume of 74.64K contracts.[1]
Zoom out on the XAUUSD chart, though, and the bigger picture tells a punchier story. Gold spent early May trading in the high 4,600s to 4,700s, eased through a choppy patch into June, then fell hard from mid-June onward, bottoming near 3,960 on 17 July.[2]
From there it staged one of its sharper comebacks of the year, recovering above 4,000 as the new trading week began, then powering through 4,040 and 4,080, before a breakout on 22 July carried it to just under 4,140, this week’s high.[2] Gravity has since taken over, and the pullback has carried into today’s session.
That leaves the moving averages sitting above spot rather than below it, which is worth flagging. The 200-period average is parked at 4,045.85, just above where gold currently trades, putting it directly in play as the nearest overhead level now that price has slipped beneath it.[1]
The 50-period average sits further back at 4,122.01, providing a higher overhead reference level following this week’s rebound.[1] With price trading below both moving averages, the 4-hour chart continues to show technical pressure despite this week’s rebound.
The RSI (14) also reflects weaker momentum: it stands at 43.48, below its RSI moving average at 59.22, per the same TradingView setup.[1] The reading remains above the conventional 30 oversold threshold, but its move below 50 points to weaker short-term momentum.
Gold price news: why XAUUSD is losing steam this week

Two of the biggest forces shaping gold this week have been the Middle East conflict and expectations around the Federal Reserve.
US forces have kept up a run of strikes on Iranian targets, and shipping through the Strait of Hormuz has stayed under pressure, with Brent crude trading near six-week highs above $94 a barrel and WTI near $89.[3] Pricier energy feeds straight into the inflation risk the Fed is weighing, exactly the kind of link that keeps showing up in gold’s day-to-day moves, even with the immediate safe-haven bid easing since Wednesday’s high.
The US data out this week argued the other side of the case. Initial jobless claims fell to 187,000 in the week to 18 July, the lowest print since 1969 and comfortably below the 212,000 consensus.[4] S&P Global is due to publish its flash Purchasing Managers’ Index for July this week, one of the last major activity readings before the Fed decision; the preview from S&P Global’s own economists frames it as a gauge of how businesses are absorbing the renewed Middle East conflict, after June’s survey pointed to resilient growth alongside cooling inflationary pressure.[5] Resilient activity data of this kind tends to put a floor under the dollar and Treasury yields, both familiar headwinds for a non-yielding asset like gold.
The US Dollar Index has held near 101 this week, above its 50-day moving average, while markets weigh a Federal Reserve decision due on 28-29 July under Chair Kevin Warsh.[6] The Fed’s target range currently stands at 3.50% to 3.75%, with markets weighing the possibility of a rate increase as renewed inflation pressures complicate the policy outlook.[6] None of that is a directional call on gold; it is simply the backdrop this XAUUSD chart is trading against.
Zoom out further and gold prices are still digesting their steepest quarterly decline in over a decade, sitting well below January’s record high above $5,500.[7] The structural story has not changed, though: a recent World Gold Council survey found central bank reserve managers largely still expect their own gold holdings to keep growing over the next year.[8]
Levels traders are watching on the XAUUSD chart
These are reference points read straight off today’s chart, not fixed floors or ceilings. Middle East headlines have blown through levels like these more than once this year, so treat them as a map, not a guarantee.
| Level | Price | Type | What it is |
| Resistance 2 | ~4,140 | Session high | 22 July high, this week’s firmest level on the Vantage CFD feed |
| Resistance 1 | 4,122.01 | 50-period MA | Nearest moving-average resistance per the chart header |
| Near-term pivot | 4,045.85 | 200-period MA | Price is trading just below the moving average, making it an immediate level to watch on any recovery |
| Support 2 | ~3,960 | Prior swing low | 17 July low on the Vantage CFD feed |
Table 1: Sources: the TradingView setup used for this analysis and the Vantage XAUUSD CFD feed. Levels as of 24 July 2026. Indicative only.
What to watch this week and beyond
- FOMC Decision, 28-29 July 2026: The Fed, chaired by Kevin Warsh, currently has a 3.50%-3.75% target range, with markets weighing the possibility of a rate increase as renewed inflation pressures complicate the policy outlook.
- US GDP Advance Estimate (Q2), 30 July 2026: The first look at second-quarter growth, released the day after the Fed decision.
- Middle East Developments, Ongoing: Any confirmed easing, or further escalation around the Strait of Hormuz, remains a source of short-term volatility for gold.
- US Dollar and Treasury Yields, Ongoing: A firmer dollar and higher yields have been a headwind for gold this week; a reversal in either would change that dynamic.
Gold’s recent range, from a low near 3,960 to a high near 4,140, is a reminder of how fast this market can move on a single headline out of the Gulf or a stray Fed comment. Risk-management tools such as Stop Loss orders can help traders define exposure around periods of elevated volatility, although execution at a specified price is not guaranteed during fast-moving markets.
Leverage is worth naming plainly here: CFDs including XAUUSD trade on margin, and margin cuts both ways. It can magnify both gains and losses, so position sizing relative to account equity matters just as much as the level itself, especially with the Fed meeting approaching.
For more gold news on how this move has built up, see our previous XAUUSD coverage, check the economic calendar for this week’s releases, brush up on XAUUSD risk management, or take a look at our gold trading guide and round-the-clock access via XAUUSD247.

RISK WARNING: CFDs are complex financial instruments and carry a high risk of losing money rapidly due to leverage. You should ensure you fully understand the risks involved and carefully consider whether you can afford to take the high risk of losing your money before trading.
Disclaimer: The information is provided for educational purposes only and doesn’t take into account your personal objectives, financial circumstances, or needs. It does not constitute investment advice. We encourage you to seek independent advice if necessary. The information has not been prepared in accordance with legal requirements designed to promote the independence of investment research. No representation or warranty is given as to the accuracy or completeness of any information contained within. This material may contain historical or past performance figures and should not be relied on. Furthermore estimates, forward-looking statements, and forecasts cannot be guaranteed. The information on this site and the products and services offered are not intended for distribution to any person in any country or jurisdiction where such distribution or use would be contrary to local law or regulation.
References
[1] “XAUUSD Chart – Gold Spot US Dollar Price – TradingView” https://www.tradingview.com/symbols/XAUUSD/ Accessed on 24 July 2026.
[2] “Gold Price Today: XAUUSD Holds $4,127 as Fed Looms – Vantage Markets” https://www.vantagemarkets.com/market-analysis/gold-price-today-xauusd-analysis-july-22-2026/ Accessed on 24 July 2026.
[3] “Brent $94, WTI $89: Crude Oil Prices Hold Near 6-Week High – Vantage Markets” https://www.vantagemarkets.com/market-analysis/crude-oil-price-today-brent-wti-usousd-ukousd-analysis-july-23-2026/ Accessed on 24 July 2026.
[4] “US Initial Jobless Claims Fall to Lowest Level Since 1969 – Bloomberg” https://www.bloomberg.com/news/articles/2026-07-23/us-initial-jobless-claims-fall-to-lowest-level-since-1969 Accessed on 24 July 2026.
[5] “Flash PMI Surveys to Help Assess Ongoing War Impact – S&P Global Market Intelligence” https://www.spglobal.com/market-intelligence/en/news-insights/research/2026/07/flash-pmi-surveys-to-help-assess-ongoing-war-impact Accessed on 24 July 2026.
[6] “US Dollar Index Price Forecast: Softens to Near 101.00, While Technicals Remain Bullish – FXStreet” https://www.fxstreet.com/news/us-dollar-index-price-forecast-softens-to-near-10100-while-technicals-remain-bullish-202607220702 Accessed on 24 July 2026.
[7] “Gold Prices Fall Further After Worst Quarter in 13 Years Amid Interest Rate Fears – CNBC” https://www.cnbc.com/2026/07/01/gold-prices-fall-worst-quarter-interest-rates-bullion-precious-metals.html Accessed on 24 July 2026.
[8] “Central Banks Set to Step Up Gold Buying Over the Next Year – World Gold Council” https://www.gold.org/news-and-events/press-releases/central-banks-set-step-gold-buying-over-next-year Accessed on 24 July 2026.
[9] “US GDP Advance Estimate, Q2 2026 – Release Schedule – U.S. Bureau of Economic Analysis” https://www.bea.gov/data/gdp/gross-domestic-product Accessed on 24 July 2026.
