


[DAILY TRADING] XAUUSD Analysis 22 July 2026 – Gold Price Today Holds Near $4,127 as Fed Looms

Vantage Editorial Team >
Vantage Editorial Team >
Vantage is a global, multi-asset broker with a team of in-house writers and market analysts who produce educational and insightful trading content for traders of all levels.
 Updated Wed, 2026 July 22 06:46
![[DAILY TRADING] XAUUSD Analysis 22 July 2026 – Gold Price Today Holds Near $4,127 as Fed Looms](https://www.vantagemarkets.com/wp-content/uploads/2026/06/XAUUSD_banner_900x430_optimized-3.webp)
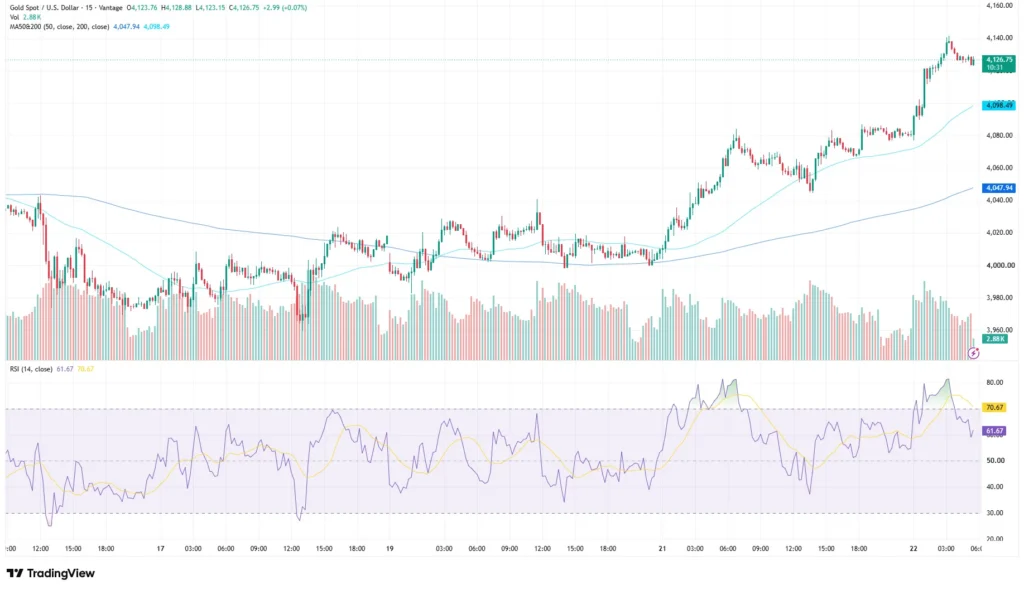
Gold caught its breath this week. After a sprint toward 4,140, the Vantage XAUUSD CFD is trading near 4,126.75 as of the chart pulled at 05:34 UTC (13:34 GMT+8) on 22 July 2026, per the TradingView setup used for this analysis.[1] In today’s XAUUSD news, that reads as a pause rather than a retreat: gold has held onto most of this week’s gains. This XAUUSD technical analysis reads the chart and the gold price news behind it; it does not call where gold goes next.
Key points
- The Vantage XAUUSD CFD trades near 4,126.75 as of 22 July 2026, holding onto most of the gains made since a low near 3,960 on 17 July.
- The 200-period moving average sits at 4,098.49 and the 50-period average at 4,047.94, both below the current price, per the TradingView setup used for this analysis.
- The RSI (14) has eased to 61.67 from readings above 70 earlier in the week, a sign the rally is losing a little steam even as price holds firm.
XAUUSD technical analysis: what the chart is showing
Wednesday’s session has been almost sleepy by comparison. Gold opened at 4,123.76, ranged between 4,123.15 and 4,128.88, then settled at 4,126.75, up 2.99 points, or 0.07%, on the Vantage CFD feed, a world away from the swings seen earlier in the week.
The pair spent 16 and 17 July drifting toward 3,960, then climbed in steps, clearing 4,000 on 19 July. The rally accelerated on 21 July through 4,040 and 4,080, before another breakout early on 22 July carried price to just under 4,140, a move that has since partially unwound.
That places the 200-period average as the nearer support, with the 50-period line further back. The RSI (14) reads 61.67, down from a peak above 80 earlier this week, with its signal line at 70.67, a cooling reading alongside a price still holding most of its gains, generally read as consolidation rather than reversal.
Gold price news: the story behind the rally

Gold’s move this week has tracked the same two headlines driving it for most of 2026: the Middle East conflict and where the Federal Reserve goes next. Gold traded near $4,071 on Tuesday, supported by fresh US-Iran strikes even as mediators pushed a proposed 10-day ceasefire, with the US 10-year Treasury yield near 4.628%, a typical headwind for non-yielding gold.[2]
Oil has told the same story. Brent crude topped $90 a barrel this week as the conflict threatened Strait of Hormuz flows, with West Texas Intermediate settling near $83.[3] Higher energy prices raise the inflation risk the Fed is weighing, a link that keeps showing up in gold’s day-to-day moves.
That policy path matters more right now. The Fed held its target range at 3.50% to 3.75% in June and announces its next decision on 29 July, with Kevin Warsh chairing the Committee.[4] Markets are broadly pricing no change, though positioning on a later move has shifted with the conflict. None of that is a directional call on gold; it is simply the backdrop the chart is trading against.
Gold is also still working through its steepest quarterly decline in 13 years, driven by a firmer dollar, higher real yields and a less dovish Fed path.[5] The recovery has clawed back only part of that move, and gold stays well below January’s record high near $5,600. Structural demand persists too: a June World Gold Council survey found most central bank reserve managers still expect gold holdings to keep rising.[6]
Levels traders are watching
These are reference points read off the current chart, not fixed floors or ceilings. Middle East headlines have overridden these levels more than once this year.
| Level | Price | Type | What it is |
| Resistance 2 | ~4,140 | Session high | 22 July high, this week’s firmest level |
| Resistance 1 | 4,128.88 | Today’s high | 22 July session high on the Vantage CFD feed |
| Support 1 | 4,098.49 | 200-period MA | Nearest moving-average support per the chart header |
| Support 2 | 4,047.94 | 50-period MA | Secondary moving-average support per the chart header |
Table 1: Sources: the TradingView setup used for this analysis and the Vantage XAUUSD CFD feed. Levels as of 22 July 2026. Indicative only.
What to watch this week
- Jobless Claims, 23 July 2026: The weekly initial claims print, one of the last US labour data points before the Fed meets.
- Flash PMIs, 24 July 2026: July manufacturing and services readings, watched for early signs of how the conflict feeds through to activity.
- FOMC Decision, 28-29 July 2026: The Fed’s next rate decision, chaired by Kevin Warsh, with markets broadly positioned for no change.
- Middle East Developments, Ongoing: A durable ceasefire, or further strikes near the Strait of Hormuz, remains a major source of short-term volatility for gold.
Gold’s range this week, from a low near 3,960 to a high near 4,140, dwarfs the tight band of the past 24 hours, and jumps of that size can happen with little warning around Middle East headlines or Fed commentary. Stop Loss placement around these levels is one way traders keep exposure defined in a market that has moved sharply in both directions this year.
Leverage is worth naming directly: CFDs including XAUUSD trade on margin. It can magnify gains, but it magnifies losses at the same rate, so position sizing matters as much as the level itself, particularly with a Fed decision one week away.
For more gold price today coverage, catch our last XAUUSD update, or explore round-the-clock access via XAUUSD247.

RISK WARNING: CFDs are complex financial instruments and carry a high risk of losing money rapidly due to leverage. You should ensure you fully understand the risks involved and carefully consider whether you can afford to take the high risk of losing your money before trading.
Disclaimer: The information is provided for educational purposes only and doesn’t take into account your personal objectives, financial circumstances, or needs. It does not constitute investment advice. We encourage you to seek independent advice if necessary. The information has not been prepared in accordance with legal requirements designed to promote the independence of investment research. No representation or warranty is given as to the accuracy or completeness of any information contained within. This material may contain historical or past performance figures and should not be relied on. Furthermore estimates, forward-looking statements, and forecasts cannot be guaranteed. The information on this site and the products and services offered are not intended for distribution to any person in any country or jurisdiction where such distribution or use would be contrary to local law or regulation.
References
[1] “XAUUSD Chart – Gold Spot US Dollar Price – TradingView” https://www.tradingview.com/symbols/XAUUSD/ Accessed on 22 July 2026.
[2] “Gold price rallies amid Gulf war strikes, strong US Dollar – FXStreet” https://www.fxstreet.com/news/gold-price-rallies-amid-gulf-war-strikes-strong-us-dollar-202607211848 Accessed on 22 July 2026.
[3] “Brent Oil Price Tops $90 as Middle East Attacks Threaten Strait of Hormuz Flows – Bloomberg” https://www.bloomberg.com/news/articles/2026-07-19/latest-oil-market-news-and-analysis-for-july-20 Accessed on 22 July 2026.
[4] “FOMC Minutes, June 16-17, 2026 – Federal Reserve” https://www.federalreserve.gov/monetarypolicy/fomcminutes20260617.htm Accessed on 22 July 2026.
[5] “Gold prices fall further after worst quarter in 13 years amid interest rate fears – CNBC” https://www.cnbc.com/2026/07/01/gold-prices-fall-worst-quarter-interest-rates-bullion-precious-metals.html Accessed on 22 July 2026.
[6] “Central banks set to step up gold buying over the next year – World Gold Council” https://www.gold.org/news-and-events/press-releases/central-banks-set-step-gold-buying-over-next-year Accessed on 22 July 2026.
