


[DAILY TRADING] SP500 Analysis 24 July 2026 – Index Steadies After Its Sharpest Slide in a Month

Vantage Editorial Team >
Vantage Editorial Team >
Vantage is a global, multi-asset broker with a team of in-house writers and market analysts who produce educational and insightful trading content for traders of all levels.
 Updated Fri, 2026 July 24 06:38
![[DAILY TRADING] SP500 Analysis 24 July 2026 – Index Steadies After Its Sharpest Slide in a Month](https://www.vantagemarkets.com/wp-content/uploads/2026/06/SP500_banner_900x430_balanced_optimized-2.webp)
The SP500 index is doing something it hasn’t done all week: sitting still. As of 05:35 UTC (13:35 GMT+8) on 24 July 2026, the Vantage SP500 CFD sits almost exactly on its 200-period moving average, a quiet moment after the S&P 500’s sharpest one-day decline in a month.
Wall Street’s benchmark fell 1.21% on 23 July, its worst session in a month.[1] Alphabet raised its 2026 spending plans, and the market didn’t love it. Tesla missed on earnings, and the market liked that even less, with oil pushing above $100 a barrel on top.[2]
By the time Asia woke up on 24 July, the SP500 chart had stopped falling. This piece reads that chart and the news behind it as they stand at the cut-off above. It isn’t a forecast, and nothing here is a recommendation to trade.
Key Points
- The SP500 CFD is holding at 7,418.04 as of 05:35 UTC (13:35 GMT+8) on 24 July 2026, sitting right on its 200-period moving average after Wall Street’s steepest one-day drop in a month.
- The S&P 500 fell 1.21% to 7,408.30 on 23 July after Alphabet raised its 2026 capital spending guidance and Tesla posted a second-quarter earnings miss.
- Brent crude’s move above $100 a barrel and a 52-week high in the 10-year Treasury yield piled on the pressure this week.
What the SP500 chart is showing today
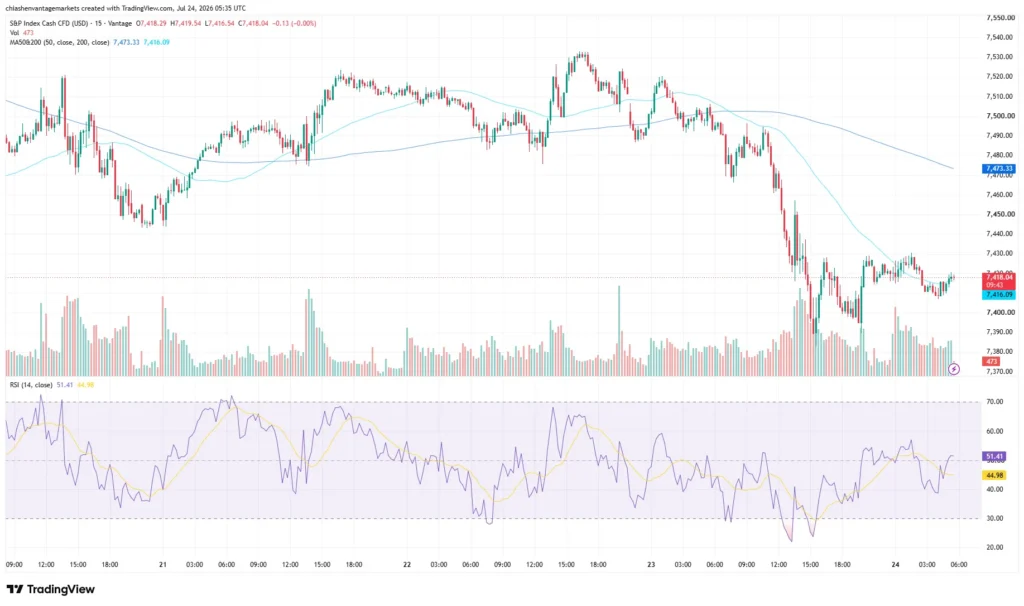
On the 15-minute chart used for this analysis, the SP500 CFD opened at 7,418.29, wobbled between 7,416.54 and 7,419.54, and settled at 7,418.04, about as calm as the tape gets. Volume, attributed to the Vantage CFD feed, read 473 contracts on the last completed candle.
Rewind three sessions and the story looks different. The index ran up to 7,540 on 21 July, then gave almost all of it back, sliding through 22 and 23 July to a low near 7,370 before finding its feet in the current 7,400 to 7,420 band.
The 50-period moving average sits at 7,473.33, the 200-period at 7,416.09, both on a close basis, and price is threading the needle: below the faster average but resting on the slower one. The RSI, attributed to the TradingView setup used for this analysis, has recovered to 51.41 after dipping below 30 during Thursday’s selloff, moving from oversold territory back above the neutral 50 level in less than 24 hours.
What’s actually moving the SP500 this week

AI spending jitters
Alphabet’s second-quarter numbers were solid. That wasn’t the problem. The company lifted its 2026 capex guidance to $195 billion to $205 billion, up from $180 billion to $190 billion, and investors read the higher spending outlook as renewing concerns over AI investment’s scale and near-term returns.[2] Shares fell around 7%, dragging Microsoft, Meta, and Amazon down with them.[2] Tesla’s revenue climbed on stronger deliveries, but earnings and free cash flow both slid, and the stock dropped 14%.[1,2] The market is re-pricing its patience with AI spending.
That patience question extends to chip suppliers such as Nvidia, since so much of that capex flows straight to their order books.
The Middle East conflict and oil
Brent crude pushed above $100 a barrel this week as the Middle East conflict continued.[2] Higher oil prices feed into inflation, and inflation feeds into what the Fed does next.
Treasury yields
The 10-year Treasury yield climbed to 4.67%, a 52-week high, adding weight to equity valuations, particularly rate-sensitive growth names.[3] Gold also fell 2.36% to $4,048.76, showing that the drop in equities did not coincide with a straightforward bid for traditional safe-haven assets.[3]
Levels to watch
The table below covers the zones traders are watching on the SP500 CFD. These are reference levels, not trade signals.
| Level | Price | What’s Happening |
| Resistance | 7,540 | Session high from 21 July, before the earnings-driven pullback |
| Resistance | 7,473 | 50-period moving average (close basis) |
| Support | 7,416 | 200-period moving average (close basis), roughly where price sits now |
| Support | 7,370 | Session low from 23 July |
Table 1: Key levels as of 05:35 UTC (13:35 GMT+8) on 24 July 2026. Source: the TradingView setup used for this analysis. Indicative only.
What to watch next
- Earnings, 24 to 31 July: More Magnificent Seven names are due to report, following Alphabet and Tesla.
- Core PCE inflation: Core PCE, the Fed’s preferred gauge, rose 3.4% year over year in May, its highest reading since October 2023.[4]
- Middle East conflict: Any change in trajectory would likely feed through to oil prices and broader risk sentiment.
- Weekly jobless claims: Along with any incremental Federal Reserve commentary on the rate path.
The index’s move from 7,540 to 7,370 in three sessions highlights the importance of risk management during periods of elevated volatility. A level such as a Stop Loss chosen in advance limits losses to a size decided before the position was open, not in the middle of a falling chart.
Leverage doesn’t care which way the SP500 index is heading; it magnifies the move either way. Position sizing relative to account equity is worth another look ahead of the next round of earnings and whatever the Middle East throws up next. The full range of index CFDs and account options sit within Vantage’s trading lineup.

RISK WARNING: CFDs are complex financial instruments and carry a high risk of losing money rapidly due to leverage. You should ensure you fully understand the risks involved and carefully consider whether you can afford to take the high risk of losing your money before trading.
Disclaimer: The information is provided for educational purposes only and doesn’t take into account your personal objectives, financial circumstances, or needs. It does not constitute investment advice. We encourage you to seek independent advice if necessary. The information has not been prepared in accordance with legal requirements designed to promote the independence of investment research. No representation or warranty is given as to the accuracy or completeness of any information contained within. This material may contain historical or past performance figures and should not be relied on. Furthermore estimates, forward-looking statements, and forecasts cannot be guaranteed. The information on this site and the products and services offered are not intended for distribution to any person in any country or jurisdiction where such distribution or use would be contrary to local law or regulation.
References
[1] “Stock Market Today: Dow, S&P Live Updates for July 23 – Bloomberg” https://www.bloomberg.com/news/articles/2026-07-23/stock-market-today-dow-s-p-live-updates Accessed on 24 July 2026.
[2] “Dow drops 500 points as Brent crude surges above $100; Alphabet and Tesla tank: Live updates – CNBC” https://www.cnbc.com/2026/07/22/stock-market-today-live-updates.html Accessed on 24 July 2026.
[3] “Stock Market Today, July 23: Tesla Drops 15%, Leading Tech Stock Slide – The Motley Fool” https://www.fool.com/coverage/stock-market-today/2026/07/23/stock-market-today-july-23-tesla-drops-15-leading-tech-stock-slide/ Accessed on 24 July 2026.
[4] “Core inflation rate hit 3.4% in May, highest since October 2023, Fed’s preferred gauge shows – CNBC” https://www.cnbc.com/2026/06/25/pce-inflation-report-may-2026-.html Accessed on 24 July 2026.
