


[DAILY TRADING] NVDA Analysis 23 July 2026 – What to Watch After Nvidia’s Pullback From the Highs

Vantage Editorial Team >
Vantage Editorial Team >
Vantage is a global, multi-asset broker with a team of in-house writers and market analysts who produce educational and insightful trading content for traders of all levels.
 Updated Thu, 2026 July 23 08:20
![[DAILY TRADING] NVDA Analysis 23 July 2026 – What to Watch After Nvidia’s Pullback From the Highs](https://www.vantagemarkets.com/wp-content/uploads/2026/06/NVDA_hero_5Jun2026.webp)
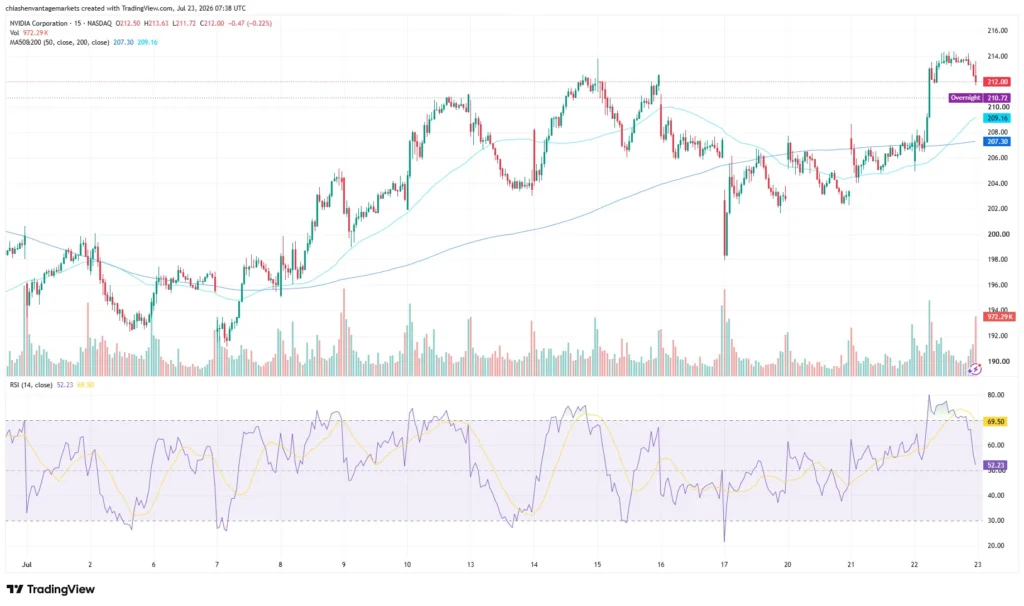
NVDA is the stock everyone claims to have an opinion on, and today it gave both the doubters and the believers something to chew on. As of 07:38 (UTC) on 23 July 2026, or 15:38 (GMT+8), Nvidia traded at $212.00 on the Vantage NVDA Contracts for Difference (CFD) feed, down $0.47, or 0.22%, at the end of a week that took the stock on a proper rollercoaster: from the mid-$190s to a fresh high and back again.
If you have been searching “NVDA stock price today” hoping for a straight answer, here is the honest one: the chart is cooling off, not falling apart, and the Nvidia news this week is more layered than any single ticker price can capture. This is the daily read on NVDA CFDs for active traders who want the chart, the headlines, and the levels, without anyone pretending to know where the Nasdaq-listed chipmaker goes next.
Key Points
- NVDA stock cooled 0.22% on the latest 15-minute bar as of 07:38 UTC (15:38 GMT+8) on 23 July 2026, which traded as high as $213.63.
- The NVDA stock chart shows the 50-period (207.30) and 200-period (209.16) moving averages both sitting below the current price following Nvidia’s rebound from its 17 July low.
- Nvidia news today centres on a trickle, not a flood, of H200 chip shipments to China, a newly closed data centre acquisition, and a fresh analyst price target.
NVDA Stock Chart Today: What the Price Action Actually Shows
Zoom into the NVDA stock chart on a 15-minute timeframe and the story is a familiar one for anyone who has followed this ticker for more than a week: a sharp move, followed by a pause to catch its breath. NVDA opened the latest candle at $212.50, poked up to $213.63, dipped to $211.72, and settled at $212.00, a move of -0.47 points, or -0.22%, on volume of 972.29K shares on the Vantage NVDA CFD feed.
Zoom out, and the bigger picture is more interesting than the intraday wobble. NVDA spent the first half of July grinding sideways in the $196 to $205 range, looking for all the world like a stock that had run out of ideas. Then it found some: a session low near $196 on 17 July gave way to a rally that cleared $208 by 21 July and touched a fresh high above $214 into 22 and 23 July. That is close to a 9% swing in under a week, on a stock most people already assume they understand.
Both key moving averages currently sit below the traded price, leaving the short-term technical structure constructive despite the latest pullback. The 50-period moving average reads 207.30 and the 200-period moving average reads 209.16 on the chart. That leaves NVDA roughly 2.3% above the 50-period line and about 1.4% above the 200-period line, both of which remain below the current price. The Relative Strength Index (RSI), on a 14-period close basis, has fallen to 52.23 after moving above 70 during the latest rally, with its moving-average overlay at 69.50 per the TradingView setup used for this analysis. That combination shows short-term momentum has cooled substantially without entering oversold territory.
Three Themes Shaping the NVDA Outlook

Beyond the 15-minute chart, three broader developments have been shaping sentiment around Nvidia this month, even if none of them map directly onto today’s single candle.
China chip licences: the door is open, the trickle is small
The US Bureau of Industry and Security began reviewing export licence applications for Nvidia’s H200 chip to China on a case-by-case basis, following a December 2025 policy shift.[1] Under Secretary of Commerce for Industry and Security Jeffrey Kessler told a congressional hearing on 14 July that “very few” H200 chips had actually reached China and Hong Kong so far.[2] The licensing pathway remains open, but the volume shipped so far has been modest relative to the market Nvidia has previously said could be worth billions of dollars in additional revenue.
A data centre deal worth knowing about
A BlackRock- and MGX-backed consortium completed its roughly $40 billion acquisition of Aligned Data Centers on 21 July and committed a further $5 billion to fund the company’s expansion.[3] Nvidia and Microsoft are strategic participants in the wider AI Infrastructure Partnership behind the deal, rather than direct buyers of Aligned itself, which underscores how closely the chipmaker is tied to the broader ecosystem of AI compute, power, and data-centre investment without Nvidia owning a stake in this particular transaction.
Custom silicon, and a fresh price target to go with it
Several of Nvidia’s largest cloud customers continue developing their own custom AI accelerators, creating a longer-term competitive consideration for Nvidia even as demand for its general-purpose GPU platforms remains strong.[4] NVDA has spent much of July wrestling with the $200 level that separates a recovery narrative from a deeper pullback, a range some chart-watchers have flagged as the key battle line for the stock this month.[5] KeyBanc’s price target for NVDA stock moved to $330 from $310 on 14 July, with the firm maintaining an overweight rating.[6] Nvidia’s market value remained around the $5 trillion mark as of 21 July, still one of the most closely tracked names on Wall Street by a wide margin.[6] Nvidia’s next scheduled catalyst is its second-quarter fiscal 2027 results, confirmed on the company’s investor relations calendar for 26 August, after the market close.[7]
Levels traders are watching
| Level | Price (USD) | What’s Happening |
| Resistance | 213.63 / ~215.00 | Latest 15-minute bar high / this week’s high |
| Last Price | 212.00 | Vantage NVDA CFD close, as of 07:38 UTC / 15:38 GMT+8, 23 July 2026 |
| Support | 209.16 / 207.30 | 200-period / 50-period moving average cluster |
The data above is referenced from the TradingView setup used for this analysis, the Vantage NVDA CFD feed, and analyst commentary cited above. Levels as of 23 July 2026.
What to watch
- Q2 FY2027 Earnings, 26 August 2026: Nvidia’s next scheduled results print, due after the market close, is the next confirmed catalyst for the stock.
- China Licensing Flow, Ongoing: Any change in the pace of H200 shipments under the case-by-case licence review is a factor traders are watching for its effect on sentiment.
- 50-/200-Period MA Cluster, Ongoing: The 207.30 to 209.16 zone is where both key moving averages currently sit, a level traders are watching should the stock pull back further from its recent high.
NVDA Stock Forecast Chatter: What the Numbers Actually Support
A lot of what turns up when someone searches “NVDA stock forecast” or “NVDA stock prediction” is exactly that, forecasting, and this piece is not adding to that pile. What the data does support is more modest, and arguably more useful: NVDA is trading above both its key moving averages, its momentum has cooled from a hotter reading, and its next hard catalyst is a scheduled earnings date rather than a guess.
KeyBanc’s price target move tells you what one analyst currently thinks NVDA stock is worth on a 12-month view, not what happens between now and then. Readers digging deeper into Nvidia’s competitive position or its last earnings print can find more background in Vantage’s coverage of Nvidia’s trade-war exposure and its most recent quarterly results, alongside a broader NVDA stock overview for anyone new to the name.
With NVDA trading roughly 2.3% above its 50-period moving average and 1.4% above its 200-period moving average after a fast run higher, volatility around this zone has picked up, and it tends not to announce itself in advance. A Stop Loss can help define an intended exit level, but it cannot eliminate gap or slippage risk; during abrupt price moves, execution may occur materially away from the specified level.
NVDA CFDs, like other share CFDs offered on Vantage’s share CFD platform, are traded with leverage, which is a double-edged tool that can magnify both gains and losses in either direction, never just one. Position sizing relative to account equity is worth revisiting ahead of Nvidia’s 26 August earnings date, a session that has historically brought a pickup in volatility. For readers building out their own technical toolkit, Vantage’s guide to RSI, MACD, and moving averages on TradingView and its overview of semiconductor stocks cover the same tools and sector used in this analysis.

RISK WARNING: CFDs are complex financial instruments and carry a high risk of losing money rapidly due to leverage. You should ensure you fully understand the risks involved and carefully consider whether you can afford to take the high risk of losing your money before trading.
Disclaimer: The information is provided for educational purposes only and doesn’t take into account your personal objectives, financial circumstances, or needs. It does not constitute investment advice. We encourage you to seek independent advice if necessary. The information has not been prepared in accordance with legal requirements designed to promote the independence of investment research. No representation or warranty is given as to the accuracy or completeness of any information contained within. This material may contain historical or past performance figures and should not be relied on. Furthermore estimates, forward-looking statements, and forecasts cannot be guaranteed. The information on this site and the products and services offered are not intended for distribution to any person in any country or jurisdiction where such distribution or use would be contrary to local law or regulation.
References
[1] “Revised Semiconductor License Review Policy for China – Bureau of Industry and Security” https://www.bis.gov/press-release/department-commerce-revises-license-review-policy-semiconductors-exported-china Accessed on 23 July 2026.
[2] “U.S. Trade Official Says ‘Very Few’ Nvidia H200 AI Chips Have Been Shipped to China – CNBC” https://www.cnbc.com/2026/07/14/nvidia-h200-ai-chips-china.html Accessed on 23 July 2026.
[3] “BlackRock-Backed Group Commits $5 Billion for Aligned Data Centers After Completing Acquisition – Reuters via U.S. News” https://money.usnews.com/investing/news/articles/2026-07-21/blackrock-backed-group-commits-5-billion-for-aligned-data-centers Accessed on 23 July 2026.
[4] “NVDA Stock Outlook: Nvidia Rebound Offers Relief but the AI Bubble Faces Tougher Questions – FX Leaders” https://www.fxleaders.com/news/2026/07/22/nvda-stock-outlook-nvidia-rebound-offers-relief-but-the-ai-bubble-faces-tougher-questions/ Accessed on 23 July 2026.
[5] “What to Expect From Nvidia Stock in July 2026: Recovery or Another Leg Down? – Yahoo Finance” https://finance.yahoo.com/news/expect-nvidia-stock-july-2026-200928604.html Accessed on 23 July 2026.
[6] “NVIDIA Corporation (NVDA) Stock Price, News, Quote & History – Yahoo Finance” https://finance.yahoo.com/quote/NVDA/ Accessed on 23 July 2026.
[7] “NVIDIA 2nd Quarter FY27 Financial Results – NVIDIA Investor Relations” https://investor.nvidia.com/events-and-presentations/events-and-presentations/event-details/2026/NVIDIA-2nd-Quarter-FY27-Financial-Results/default.aspx Accessed on 23 July 2026.
[8] “NVDA: NVIDIA Corp – Stock Price, Quote and News – CNBC” https://www.cnbc.com/quotes/NVDA Accessed on 23 July 2026.
