


US Dollar Index (DXY) Holds 100.59 as Hawkish Fed Meets Soft CPI

Vantage Editorial Team >
Vantage Editorial Team >
Vantage is a global, multi-asset broker with a team of in-house writers and market analysts who produce educational and insightful trading content for traders of all levels.
 Updated Mon, 2026 July 20 02:33
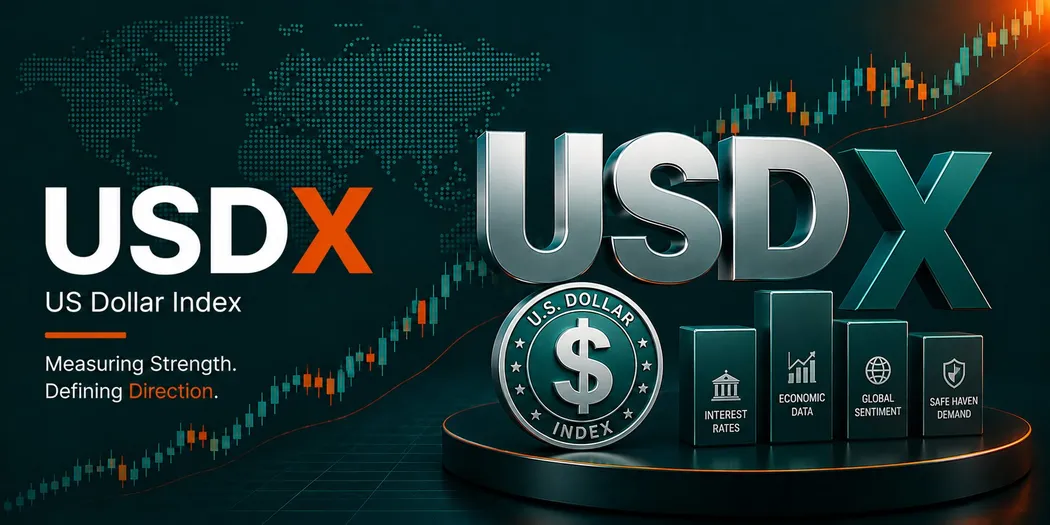
Ask what direction the US Dollar Index is heading right now, and the honest answer is that the chart does not offer a clean one. As of 09:50 (GMT+8) / 01:50 UTC on 20 July 2026, the DXY sits at 100.59, based on the Vantage USDX CFD 4H chart, roughly two points off its late-June high and remaining range-bound. Rather than signalling a clear directional trend, the current price action reflects competing macroeconomic drivers: a war premium, a cooling inflation print, and a Federal Reserve talking tough even as officials remain divided over the appropriate policy path, all showing up on the same US dollar index chart at once.
Key points
- The US Dollar Index has eased to around 100.59, pulling back from a late-June peak near 101.20 to 101.40 and a brief push above 101 in mid-July.
- June’s Consumer Price Index cooled to 3.5% year-on-year, well below the 3.8% forecast, easing near-term pressure for a rate rise even as the Fed’s own dot plot still points the other way.
- The Middle East conflict reignited in mid-July, with Iran’s announced closure of the Strait of Hormuz and renewed strikes lifting oil prices and keeping the dollar’s safe-haven bid alive.
What the USDX chart is showing
On the 4H dollar index chart, the US Dollar Index CFD last closed near 100.59, with the session ranging between 100.57 and 100.68 as of the cut-off above. Zoom out, and the U.S. dollar index has spent the past several weeks quietly unwinding a rally that carried it from around 98.30 in mid-May to a peak near 101.40 in late June, the kind of round trip that looks dramatic on a dollar index graph and far less dramatic once you notice it has taken two months.
The 50-period moving average on this setup sits at 100.674, just above the current price, while the 200-period moving average is at 100.365, some way below. That puts the index in the narrow gap between its short-term and long-term averages, consistent with a market that has lost short-term momentum without doing any real damage to its longer trend.
The RSI (14, close), as read from the TradingView setup used for this analysis, sits at 50.70, with its moving-average overlay at 44.81. Neither reading is close to overbought or oversold. For a USDX chart that spent June making headlines, this is about as unremarkable as the RSI gets, which is itself worth noting.
Read the latest USDX news here.

The three things pulling the dollar index in different directions
The Middle East conflict: a safe-haven bid that refuses to fully fade
The conflict involving the United States and Iran, which began in late February 2026, looked to be cooling through most of June before flaring again in mid-July.[1] Renewed strikes and Iran’s announced closure of the Strait of Hormuz coincided with oil prices jumping from around $76 to close to $85 a barrel within days.[2] The strait carries close to one-fifth of global crude supply, and its status remains a live watch item for energy-linked inflation risk.[3]
For the dollar, this has been a double-edged story rather than a one-way trade. The geopolitical tensions have supported demand for the US dollar as a safe-haven asset while simultaneously lifting oil prices through concerns over supply disruptions, and those higher oil prices complicate the Fed’s inflation math by pushing energy costs back into the headline number. Meanwhile the yen and gold, the market’s other traditional safe havens, have not behaved as expected this year, with US Treasury yields near 4.0% to 4.1% and a still-firm dollar dampening some of their usual appeal.[4]
The Fed under Warsh: a committee split down the middle
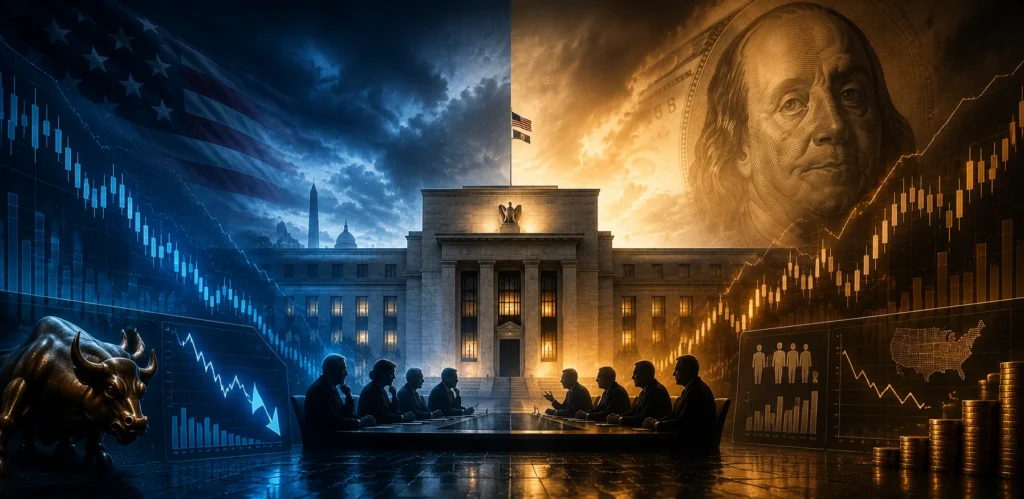
Kevin Warsh took over as Fed Chair in May 2026, and his first meeting as chair on 17 June 2026 saw the committee hold its benchmark rate at 3.50% to 3.75% unanimously, stripping out language pointing to future cuts.[5] The dot plot pointed to a median expectation of one quarter-point rate rise by the end of 2026, up from March, though one participant’s dot appeared to be missing, believed to be Warsh’s own.
The minutes from that meeting, released on 8 July 2026, showed the committee close to evenly divided: half of the eighteen officials who submitted projections favoured holding or trimming rates, half favoured raising them before year end.[6] Warsh has been consistent in saying inflation remains “too high,” even while voicing some openness to artificial intelligence proving disinflationary over time.[7] The next FOMC decision lands on 29 July 2026, though this meeting carries no updated Summary of Economic Projections, which is only published in March, June, September and December.[8]
The data: a cooler CPI print meets a soft jobs report
June’s Consumer Price Index, released on 14 July, told a different story to the Fed’s hawkish June tilt. Headline inflation eased to 3.5% year-on-year, down from 4.2% in May and below the 3.8% consensus, with the 0.4% monthly decline the largest since April 2020 on a sharp drop in gasoline prices.[9] Core CPI held at 2.6% year-on-year, also softer than expected.
That followed a June jobs report that was soft in its own right. Non-farm payrolls rose by just 57,000, well short of the roughly 115,000 consensus, with April and May revised down by a combined 74,000.[10] The unemployment rate dipped to 4.2%, largely because labour force participation fell to 61.5%, the lowest since March 2021, rather than because hiring strengthened.[11] Put the two releases together and the case for a near-term rate rise looks harder to make than the June statement suggested, even as the Middle East energy shock keeps the inflation story from fully going away.
Levels traders are watching on the DXY and major USD pairs
The table below summarises the ranges traders have been monitoring across the US dollar index and major USD pairs. These are reference points drawn from recent trading activity, not trade signals.
| Pair | Recent Range | What’s Happening |
| DXY | 100.00 to 101.40 | Near 100.59, consolidating below the 50-period moving average after the late-June peak |
| EURUSD | 1.1350 to 1.1900 | Trading near 1.1446, holding within its recent range |
| USDJPY | 160.00 to 163.00 | Near 162.40, still close to its 52-week high, with yen intervention a persistent watch item above 162 |
| GBPUSD | 1.3300 to 1.3550 | Near 1.3452, comparatively steady against the broader dollar moves |
The levels above are indicative reference ranges only, drawn from recent trading activity rather than fixed technical levels. Sources: Reuters, Trading Economics, Yahoo Finance, TradingView. Data as of 17 to 20 July 2026.
A few things worth flagging on specific pairs: the euro has been comparatively resilient, holding above 1.14 even as the dollar found support from the Middle East conflict, which suggests the eurozone side of the pair has its own drivers in play. The Japanese yen has weakened to levels last seen in decades, and USDJPY has stayed close to its 52-week high near 162.80, an area where Bank of Japan intervention has previously been a live risk. Gold (XAUUSD) has consolidated broadly in the $4,400 to $4,700 zone through the middle of the year, with a firmer dollar and higher real yields offsetting some of the usual safe-haven demand tied to the conflict.
For continuing coverage of the index between weekly updates, see Vantage’s previous USDX analysis, and the broader range of forex CFDs available for the major USD pairs referenced above.
What to watch this week and beyond
- FOMC Decision, 29 July 2026: The Fed’s next scheduled rate decision, due at 2:00pm ET, with no Summary of Economic Projections at this meeting. Markets will be reading the statement and press conference for any shift in the split flagged in the June minutes.
- July CPI, 12 August 2026: The next inflation print is not due until mid-August, meaning the June cooling will remain the most recent inflation data point traders have through the July FOMC meeting.
- Strait of Hormuz developments: Any credible signal on shipping conditions through the strait remains one of the more direct channels between the Middle East conflict and near-term inflation expectations.
- US-China trade headlines: Renewed friction around trade and political comments between Washington and Beijing has resurfaced as a risk-sentiment factor and could keep influencing dollar flows alongside the usual data calendar.
On risk management, the DXY has been reacting quickly to geopolitical headlines out of the Middle East, and standard intraday range assumptions have been less reliable through this stretch. Stop Loss placement around the levels flagged above is one of the tools traders commonly use to manage this kind of headline-driven volatility, and it limits losses to a planned size rather than preventing losses altogether. Traders holding positions across correlated USD pairs, yen, or gold should also stay mindful of combined exposure, since a fast risk-off move can pull several of these markets in the same direction at once.
Leverage works both ways in a range like this one, magnifying gains and losses alike. Position sizing relative to account equity is worth revisiting ahead of the 29 July 2026 FOMC decision, given how quickly this index has moved on headlines over the past month.

RISK WARNING: CFDs are complex financial instruments and carry a high risk of losing money rapidly due to leverage. You should ensure you fully understand the risks involved and carefully consider whether you can afford to take the high risk of losing your money before trading.
Disclaimer: The information is provided for educational purposes only and doesn’t take into account your personal objectives, financial circumstances, or needs. It does not constitute investment advice. We encourage you to seek independent advice if necessary. The information has not been prepared in accordance with legal requirements designed to promote the independence of investment research. No representation or warranty is given as to the accuracy or completeness of any information contained within. This material may contain historical or past performance figures and should not be relied on. Furthermore estimates, forward-looking statements, and forecasts cannot be guaranteed. The information on this site and the products and services offered are not intended for distribution to any person in any country or jurisdiction where such distribution or use would be contrary to local law or regulation.
References
[1] “Iran conflict challenges safe-haven status of US Treasurys, yen, and gold – Crypto Briefing” https://cryptobriefing.com/iran-conflict-challenges-safe-haven-status-of-us-treasurys-yen-and-gold/ Accessed on 20 July 2026.
[2] “Oil price jumps 14% to $84 per barrel as US-Iran ceasefire collapses – Vanguard News” https://www.vanguardngr.com/2026/07/oil-price-jumps-14-to-84-per-barrel-as-us-iran-ceasefire-collapses/ Accessed on 20 July 2026.
[3] “Market Quick Take – Iran strikes rattle markets – 13 July 2026 – Saxo” https://www.home.saxo/content/articles/macro/market-quick-take—iran-strikes-rattle-markets—13-july-2026-13072026 Accessed on 20 July 2026.
[4] “Iran conflict challenges safe-haven status of US Treasurys, yen, and gold – Crypto Briefing” https://cryptobriefing.com/iran-conflict-challenges-safe-haven-status-of-us-treasurys-yen-and-gold/ Accessed on 20 July 2026.
[5] “US Federal Reserve holds rates steady under new chair Warsh – Al Jazeera” https://www.aljazeera.com/economy/2026/6/17/us-federal-reserve-holds-rates-steady-under-new-chair-warsh Accessed on 20 July 2026.
[6] “Fed Chief Kevin Warsh declines to hint at July rate decision – Chase” https://www.chase.com/personal/investments/learning-and-insights/article/kevin-warsh-prices-are-too-high-what-to-expect-july-2026-federal-reserve-meeting Accessed on 20 July 2026.
[7] “Fed Chief Kevin Warsh declines to hint at July rate decision, but says inflation ‘too high’ – CNBC” https://www.cnbc.com/2026/07/01/kevin-warsh-ecb-forum-live-updates.html Accessed on 20 July 2026.
[8] “FOMC Meeting Schedule July 2026 – Dates & Time – FedRateCalc” https://fedratecalc.com/fomc-meeting-schedule/july-2026/ Accessed on 20 July 2026.
[9] “Inflation eased more than expected in June as gas prices fell, CPI report shows – CBS News” https://www.cbsnews.com/news/june-2026-cpi-report/ Accessed on 20 July 2026.
[10] “U.S. job creation cools in June with payrolls growth of just 57,000; unemployment rate at 4.2% – CNBC” https://www.cnbc.com/2026/07/02/jobs-report-june-2026-.html Accessed on 20 July 2026.
[11] “TD Economics – U.S. Employment (June 2026)” https://economics.td.com/us-employment Accessed on 20 July 2026.
