


[DAILY TRADING] USDJPY Analysis 24 July 2026 — Yen Steadies After Its Wildest Week in Decades

Vantage Editorial Team >
Vantage Editorial Team >
Vantage is a global, multi-asset broker with a team of in-house writers and market analysts who produce educational and insightful trading content for traders of all levels.
 Updated Fri, 2026 July 24 03:40
![[DAILY TRADING] USDJPY Analysis 24 July 2026 — Yen Steadies After Its Wildest Week in Decades](https://www.vantagemarkets.com/wp-content/uploads/2026/06/usdjpy_hero-1.webp)
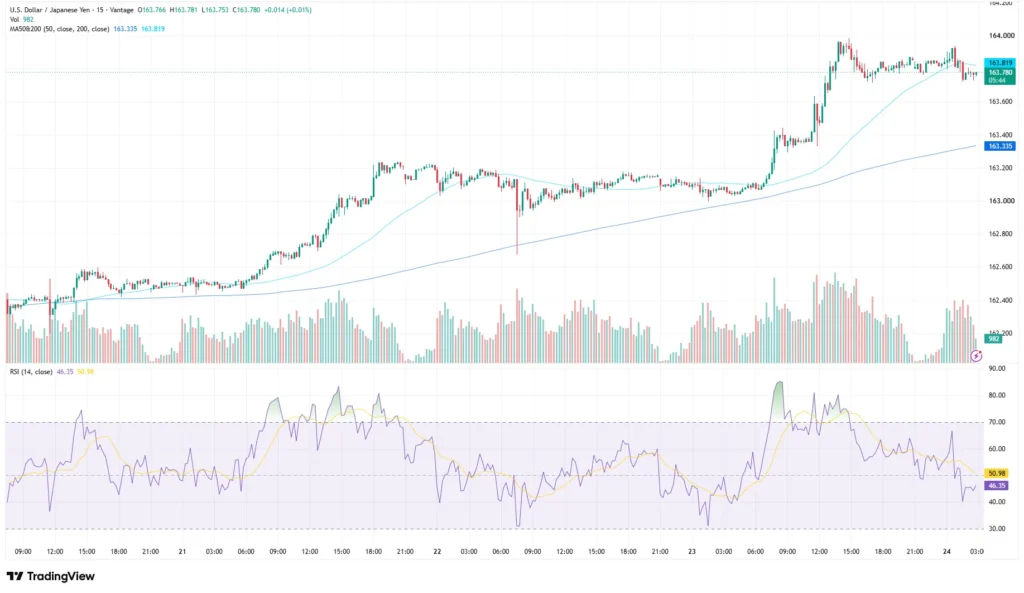
Four decades. That is how far back you have to rewind to find USD/JPY trading this high, and this week the pair got there, then thought better of it. The Vantage USDJPY CFD traded near 163.780 as of 02:54 UTC (10:54 GMT+8) on 24 July 2026, just below its 200-period moving average and well above its 50-period average, after the yen weakened to a roughly 40-year low against the dollar earlier in the week1.
This USDJPY forecast today reads the chart and macro backdrop as they stand, for active traders following USD/JPY intraday.
Key Points
- USD/JPY traded near 163.780 as of 10:54 (GMT+8) on 24 July 2026, consolidating just under its 200-period moving average after the yen weakened to roughly a 40-year low against the dollar earlier in the week.
- The yen firmed briefly after Bloomberg and Reuters reported that Bank of Japan officials are open to faster rate hikes than the twice-a-year cadence markets had priced in.
- The RSI (14) from the TradingView setup used for this analysis reads 46.35, below its moving-average overlay of 50.98, a clear cooldown from the week’s overbought spike.
What the USDJPY Chart Is Showing Today
On the 15-minute chart, USD/JPY spent the early week grinding higher from a base near 162.35, building on levels flagged in Monday’s daily analysis, then lurched to an intraday high just above 164.00 on Wednesday2 (Figure 1). That move has since run out of steam. Since Thursday’s Asia session, the pair has settled into a band between roughly 163.60 and 163.90, with the 163.780 print at the cut-off sitting almost dead centre.
The moving averages back that up. The 50-period sits at 163.335, the 200-period at 163.819, both from the TradingView setup used for this analysis. Price sits just below the longer-term average and comfortably above the shorter-term one. That configuration shows price holding above the shorter-term average while it consolidates just beneath the longer-term one following the breakout.
The RSI (14) also reflects softer momentum: it stands at 46.35, below the neutral 50 level and below its moving-average overlay at 50.98, a marked cooldown from the overbought territory flagged during Wednesday’s spike. For now, momentum has faded right alongside price.
Why the Yen Keeps Testing These Levels

This pullback lines up with real news, not chart fatigue. The yen weakened to a roughly 40-year low against the dollar as USD/JPY climbed above 163 this week, before Bloomberg, then Reuters, reported Bank of Japan officials are open to hiking rates faster than the roughly twice-yearly pace markets had been expecting1, a shift in tone from a central bank that only just took its policy rate to 1%, its highest since 1995, back in June 20262.
Behind that sits a messier political story: markets have spent months adjusting to Prime Minister Sanae Takaichi’s administration, seen as reluctant to let the BOJ tighten too quickly, even as elevated oil prices tied to the Middle East conflict squeeze Japan’s import bill1. Tokyo has kept the verbal pressure on too, repeatedly calling the yen’s moves ‘one-sided,’ language that usually precedes intervention if things get much worse1.
The next real test lands 30-31 July, when the BOJ delivers its decision with a quarterly Outlook Report7. Fed Chair Kevin Warsh, who called inflation ‘too high’ at Sintra this month, meets just before that, on 28-29 July 20265,6. This week’s rate story has come almost entirely from Tokyo rather than Washington. For background, see the Vantage guide to trading USDJPY.
USDJPY Levels to Watch
The table below covers the zone traders are watching on USD/JPY as of the cut-off. These are reference levels, not trade signals. Background on how to read levels like these is available on the Vantage Academy.
| Pair | Support | Resistance | What’s Happening |
| USDJPY | 163.335 / 162.35 | 163.819 / 164.20 | Consolidating just under the 200-period MA after the yen weakened to a roughly 40-year low as USD/JPY climbed above 163 |
Table 1: Key reference levels, Vantage USDJPY CFD, TradingView. As of 02:54 UTC (10:54 GMT+8), 24 July 2026. Indicative only.
163.335, where the 50-period average sits, is the nearest floor below current price, with 162.35 the next zone of interest. On the upside, the 200-period MA at 163.819 sits just above current price, with the week’s high above 164.00 the level to watch if the yen’s bounce loses conviction.
What to Watch Next
- BOJ Policy Meeting, 30-31 July 2026: the quarterly Outlook Report is the biggest catalyst for USDJPY into month-end.
- FOMC Meeting, 28-29 July 2026: the Fed’s rate decision and Chair Warsh’s tone on inflation will be closely watched.
- Japanese verbal intervention: officials have called the yen’s moves ‘one-sided’ repeatedly this month; escalation, or confirmed operations, would move the pair fast.
- Middle East conflict and oil prices: elevated energy costs keep weighing on Japan’s import bill and have driven yen weakness this year.
USD/JPY has moved several hundred pips in days, and its reaction to BOJ headlines shows how fast conditions can shift intraday. The 163.335 and 163.819 levels above may be useful reference points for risk management given the pair’s sensitivity to BOJ commentary. A Stop Loss limits losses to a planned size rather than preventing them outright.
Leverage is a double-edged tool that magnifies both gains and losses in either direction. It is worth revisiting leverage and position sizing ahead of the BOJ and Fed, especially alongside other yen-correlated positions such as gold or Japanese equity CFDs.

RISK WARNING: CFDs are complex financial instruments and carry a high risk of losing money rapidly due to leverage. You should ensure you fully understand the risks involved and carefully consider whether you can afford to take the high risk of losing your money before trading.
Disclaimer: The information is provided for educational purposes only and doesn’t take into account your personal objectives, financial circumstances, or needs. It does not constitute investment advice. We encourage you to seek independent advice if necessary. The information has not been prepared in accordance with legal requirements designed to promote the independence of investment research. No representation or warranty is given as to the accuracy or completeness of any information contained within. This material may contain historical or past performance figures and should not be relied on. Furthermore estimates, forward-looking statements, and forecasts cannot be guaranteed. The information on this site and the products and services offered are not intended for distribution to any person in any country or jurisdiction where such distribution or use would be contrary to local law or regulation.
References
[1] “Yen steadies near 40-year low on rate-hike bets, intervention talks – Reuters via Investing.com” https://ca.investing.com/news/economy-news/yen-slides-past-163-raising-intervention-alert-4745198 Accessed on 24 July 2026.
[2] “Bank of Japan hikes rates to 1%, highest since 1995, as yen and inflation worries take hold – CNBC” https://www.cnbc.com/2026/06/16/boj-rate-hike-historic-inflation.html Accessed on 24 July 2026.
[3] “Japanese Yen – Quote, Chart, Historical Data and News – Trading Economics” https://tradingeconomics.com/japan/currency Accessed on 24 July 2026.
[4] “Japan Interest Rate – Trading Economics” https://tradingeconomics.com/japan/interest-rate Accessed on 24 July 2026.
[5] “Minutes of the Federal Open Market Committee, June 16-17, 2026 – Federal Reserve” https://www.federalreserve.gov/monetarypolicy/fomcminutes20260617.htm Accessed on 24 July 2026.
[6] “Fed Chief Kevin Warsh declines to hint at July rate decision, but says inflation ‘too high’ – CNBC” https://www.cnbc.com/2026/07/01/kevin-warsh-ecb-forum-live-updates.html Accessed on 24 July 2026.
[7] “BOJ on alert to price risks that may lead to faster rate hikes, sources say – Reuters via WMBD” https://wmbdradio.com/2026/07/22/boj-on-alert-to-price-risks-that-may-lead-to-faster-rate-hikes-sources-say/ Accessed on 24 July 2026.
