


US Dollar Index (DXY): Bracing for This Week’s Big Fed Call

Vantage Editorial Team >
Vantage Editorial Team >
Vantage is a global, multi-asset broker with a team of in-house writers and market analysts who produce educational and insightful trading content for traders of all levels.
 Updated Mon, 2026 July 27 02:57
Here’s the dollar index in one sentence: it can’t decide what it wants to be this week. The US Dollar Index (DXY) traded at 101.011 as of 09:25 (GMT+8) / 01:25 UTC on 27 July 2026, based on the Vantage USDX CFD 4-hour chart, down 0.29% on the latest 4-hour candle and just under half a point below its high for the week.
Not dramatic on its own, but the timing matters: the pullback lands two days before the Fed’s next rate decision, an event that tends to reset a chart mid-range.
This week’s Federal Open Market Committee meeting runs 28 to 29 July 2026, decision due Wednesday at 2:00pm ET. The meeting does not include an updated Summary of Economic Projections or dot plot.[1,3] It is only the second meeting under Fed Chair Kevin Warsh, who held the funds rate at 3.50% to 3.75% in June 2026.[2] With no fresh projections to lean on, markets are reading tone, not tables.
Behind the stall in the DXY’s climb is a tug of war: the Middle East conflict, whose attacks and pauses keep whipsawing energy prices, a Fed maintaining a data-dependent policy stance, and a currency market trying to price both stories at once. For traders watching the dollar index, that helps explain the market’s struggle to find a clear near-term direction.
This piece covers what the USDX chart is showing, the macro backdrop behind it, and what could move USD pairs this week. All levels below are as of 09:25 (GMT+8) / 01:25 UTC on 27 July 2026. Charts are indicative and sourced from TradingView. This is not financial advice.
Key Points
- The dollar index eased to 101.011 as of 27 July 2026, pulling back from a high near 101.50 struck around 23 to 24 July, while still holding above both its 50- and 200-period moving averages.
- The Fed’s July FOMC meeting runs 28 to 29 July 2026 with no fresh dot plot; the last projections showed that nine of 18 participants expected at least one 2026 rate hike.[3]
- The Middle East conflict pushed Brent above $100 a barrel around 23 July 2026, but a pause in US-Iran attacks since the weekend has sent oil sharply lower again, adding another layer of noise to the Fed’s inflation math.[10,11]
What the USDX chart is actually showing
Pull up the USDX chart and the story since May is a simple one: a slow grind higher that occasionally forgets to be slow. The index opened the period trading roughly between 97 and 99, climbed steadily through May and June, then a sharper leg carried it above 101 for the first time since spring. That rally took a breather through late June and early July, chopping sideways, before waking back up in the third week of July and pushing to a fresh high near 101.50 around 23 to 24 July 2026. What has happened since is the pullback sitting in today’s candle.
At 101.011, price still sits above both the 50-period moving average (100.581) and the 200-period moving average (100.786) on the Vantage USDX CFD 4-hour setup, a structure that has generally lined up with the broader climb since the averages themselves turned higher back in June 2026.
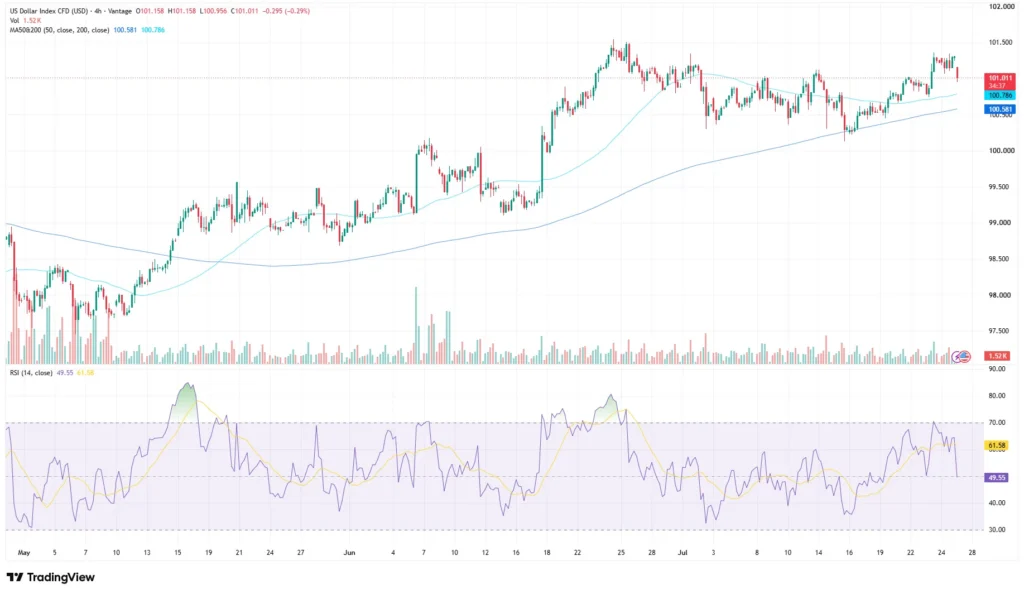
The Relative Strength Index reads 49.55, while its RSI-based moving average stands at 61.58, the TradingView setup used for this analysis shows. The RSI’s retreat toward the neutral 50 level indicates that short-term momentum has cooled: price has held its recent gains without shoving back into overbought territory, and the softer RSI print tracks the pullback on the candles. Volume on the latest 4-hour bar came in at 1.52 thousand lots on the Vantage CFD feed, nothing out of the ordinary for the week.
The broader 4-hour structure remains upward-sloping, although price action has become more range-bound since late June. A sustained close above 101.50 would signal a break above the recent range high. A slide toward the rising 200-period average near 100.79 would test an important area of dynamic support.
The macro backdrop the chart cannot show you

The Fed walks in with rates parked at 3.50% to 3.75%, the committee flagging elevated uncertainty and inflation still above its 2% goal.[2] June’s dot plot nudged the median 2026 rate projection higher, with nine of 18 participants projecting at least one 2026 rate hike, alongside a bump in projected core PCE inflation to 3.3% for 2026.[3] No updated projections this time, so the statement’s wording and Warsh’s press conference do the work a dot plot usually does.[1,3]
Then there is the Middle East conflict, which took a sharp turn in the past few days. Brent broke back above $100 a barrel for the first time in nearly two months around 23 July as US-Iran strikes escalated, extending a run that had already lifted it above $90 in mid-July.[4,10] That premium is now unwinding: Brent fell more than 5% as trading reopened on Monday, retreating toward $91 a barrel as the pause in attacks reduced the geopolitical risk premium, with WTI easing alongside it.[10,11] A sustained pause would ease the inflation pressure the Fed is watching; a return to strikes would put it straight back on the table.
Over in the G10 space, the yen keeps drawing comparisons to earlier episodes where a weak currency brought Bank of Japan intervention chatter back, historically around the time the pair traded above the 160 handle.[6] That keeps USDJPY one of the twitchier components in the basket this week, with both a Fed decision and an active conflict on the calendar.
Third-party forecasters cannot agree either. As summarized by Capital.com, Natixis has the DXY drifting toward 98 by year-end on fading rate-differential support, while MTFX Group calls the dollar firm but less one-sided, pointing to sticky inflation and a cautious Fed.[8] The divergence highlights the uncertainty surrounding the dollar’s medium-term outlook.
Levels to watch and risk framing
The US dollar index today is holding a fairly tight structure: above its moving averages, below its recent high, waiting on a headline. The table below sets out the reference zone traders have been watching on the dollar index chart. This is a structural level drawn from recent price action, not a trade signal. For background on the underlying currency itself, see our US Dollar definition.
| Instrument | Support | Resistance | What’s happening |
| DXY | 100.581 / 100.786 (50- and 200-period MAs) | 101.50 | Holding above both moving averages after easing from the 23 to 24 July high |
Table 1: Key levels as of 09:25 (GMT+8), 27 July 2026. Source: Vantage USDX CFD 4-hour chart, TradingView. Indicative only.
What to watch this week and beyond
- FOMC Rate Decision, 29 July 2026: The main event for USD pairs this week; markets widely expect the Fed to hold at 3.50% to 3.75% again, leaving tone as the swing factor.[1,2]
- FOMC Press Conference, 29 July 2026: Warsh’s comments could provide additional signals on the policy outlook following the rate decision.[2]
- Nonfarm Payrolls, 7 August 2026: The next major data point, feeding the Fed’s September debate alongside mid-August CPI.[9]
- Middle East conflict, Ongoing: The pause in US-Iran attacks since 25 to 26 July has already pulled oil off its highs; whether it holds through the week is one of the bigger swing factors for the inflation outlook the Fed is weighing.[10,11]
The pullback arrives just before a Fed decision that could reset the range either way, and event-driven volatility around FOMC announcements has shown up on the USDX chart repeatedly this year. The 100.581 to 100.786 moving-average band and the recent high near 101.50 provide technical reference points for assessing the index’s response to the Fed decision. Anyone holding correlated positions across other USD pairs, the yen, or gold should also account for how quickly those can move together, and Stop Loss placement and overall exposure are worth reviewing ahead of an event like this.
Leverage works both ways in a week carrying this much event risk, amplifying gains and losses alike, so position sizing relative to account equity is worth revisiting ahead of Wednesday’s decision and next week’s jobs report.
For more on how this range has been building, see last week’s US dollar index update and the prior DXY forecast from the week before, or the mid-July USDX chart breakdown for how the consolidation phase started.
RISK WARNING: CFDs are complex financial instruments and carry a high risk of losing money rapidly due to leverage. You should ensure you fully understand the risks involved and carefully consider whether you can afford to take the high risk of losing your money before trading.
Disclaimer: The information is provided for educational purposes only and doesn’t take into account your personal objectives, financial circumstances, or needs. It does not constitute investment advice. We encourage you to seek independent advice if necessary. The information has not been prepared in accordance with legal requirements designed to promote the independence of investment research. No representation or warranty is given as to the accuracy or completeness of any information contained within. This material may contain historical or past performance figures and should not be relied on. Furthermore estimates, forward-looking statements, and forecasts cannot be guaranteed. The information on this site and the products and services offered are not intended for distribution to any person in any country or jurisdiction where such distribution or use would be contrary to local law or regulation.
References
[1] “Meeting calendars and information – Board of Governors of the Federal Reserve System” https://www.federalreserve.gov/newsevents/2026-july.htm Accessed on 27 July 2026.
[2] “FOMC Meeting Summary – Wells Fargo Investment Institute” https://www.wellsfargoadvisors.com/research-analysis/reports/fed-rate.htm Accessed on 27 July 2026.
[3] “Fed Meeting Tracker 2026: How Interest Rate Shifts Shape Investor Strategy in July – Forbes” https://www.forbes.com/sites/investor-hub/article/fed-meeting-tracker-interest-rate-strategy/ Accessed on 27 July 2026.
[4] “Brent Oil Price Tops $90 as Middle East Attacks Threaten Strait of Hormuz Flows – Bloomberg” https://www.bloomberg.com/news/articles/2026-07-19/latest-oil-market-news-and-analysis-for-july-20 Accessed on 27 July 2026.
[5] “United States Dollar – Quote, Chart, Historical Data and News – Trading Economics” https://tradingeconomics.com/united-states/currency Accessed on 27 July 2026.
[6] “Chart alert: USD/JPY breaches above 160, 21-month high, ignoring intervention risk – MarketPulse by OANDA Group” https://www.marketpulse.com/markets/chart-alert-usdjpy-breaches-above-160-21-month-high-ignoring-intervention-risk/ Accessed on 27 July 2026.
[7] “US Dollar Index Historical Data (DXY) – Investing.com” https://www.investing.com/indices/usdollar-historical-data Accessed on 27 July 2026.
[8] “US Dollar Index Forecast – Capital.com” https://capital.com/en-int/analysis/usd-forecast Accessed on 27 July 2026.
[9] “US Employment Situation (Non-Farm Payrolls) August 2026: Date, Time and What to Expect – Finance Calendar” https://www.financecalendar.com/event/us-employment-situation-non-farm-payrolls-august-2026/ Accessed on 27 July 2026.
[10] “Brent crude oil – Price, Chart, Historical Data and News – Trading Economics” https://tradingeconomics.com/commodity/brent-crude-oil Accessed on 27 July 2026.
[11] “Oil Slumps at Week’s Open as Washington and Tehran Pause Attacks – Bloomberg” https://www.bloomberg.com/news/articles/2026-07-26/latest-oil-market-news-and-analysis-for-july-27 Accessed on 27 July 2026.
