


[DAILY TRADING] XAUUSD Analysis 27 July 2026 – Gold Holds Above Its Averages as U.S.-Iran Pause Eases Rate Pressure

Vantage Editorial Team >
Vantage Editorial Team >
Vantage is a global, multi-asset broker with a team of in-house writers and market analysts who produce educational and insightful trading content for traders of all levels.
 Updated Mon, 2026 July 27 05:58
![[DAILY TRADING] XAUUSD Analysis 27 July 2026 – Gold Holds Above Its Averages as U.S.-Iran Pause Eases Rate Pressure](https://www.vantagemarkets.com/wp-content/uploads/2026/06/XAUUSD_banner_900x430_optimized-3.webp)
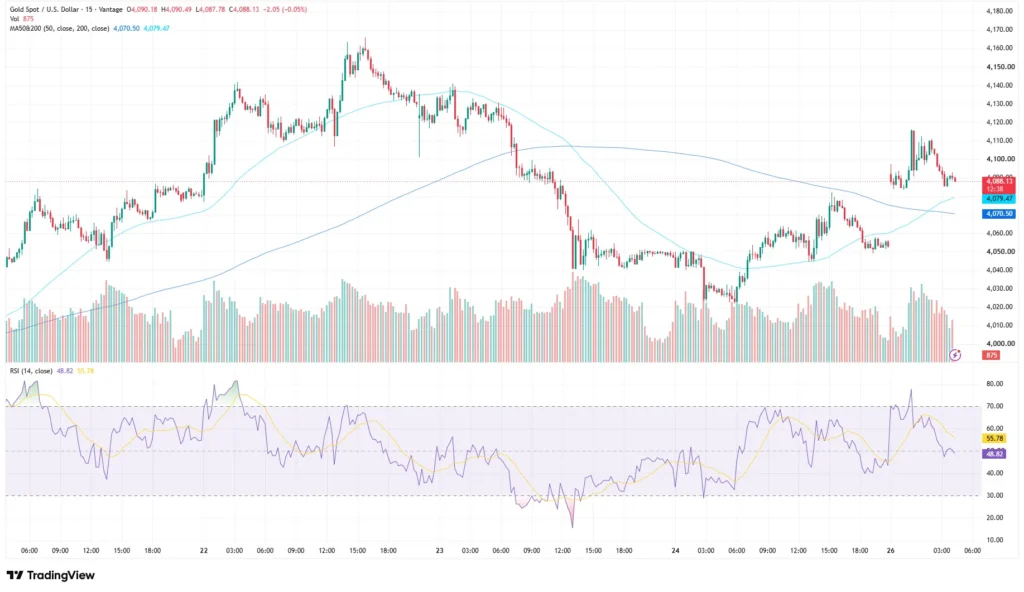
Gold had quite the week, and Monday looks almost sedate by comparison. The Vantage XAUUSD CFD traded near $4,088.13 as of the chart pulled at 04:17 UTC (12:17 GMT+8) on 27 July 2026, down $2.05, or 0.05%, on the latest 15-minute candle.[1]
That is barely a ripple next to gold’s round trip: a spike above $4,160, a slide near $4,000, and a scramble back above $4,100, all inside a week. In today’s XAUUSD news, the XAUUSD price is consolidating above its 50 and 200-period moving averages, calmer than last week.
This XAUUSD technical analysis reads the gold price today and the gold price news behind it, not where gold goes next.
What the XAUUSD Chart Is Showing
Pull up the XAUUSD TradingView chart and the past week reads like a mood swing. Gold pushed to a high near $4,163 early on, then gave most of it back into 24 July, touching a low near $4,000 as the RSI dropped into oversold territory below 20, per the TradingView setup used for this analysis. Volume picked up through that slide, per the Vantage CFD feed, before easing again as the pair based out near the lows. A weekend rebound then carried price back above $4,100, and Monday has spent its energy settling rather than sprinting.
The 50-period moving average sits at $4,070.50 and the 200-period average at $4,079.47, both just below the current print, per the TradingView setup used for this analysis. Gold is trading above both its 50- and 200-period moving averages, although momentum has cooled following the weekend rebound. The RSI reading of 48.82 has slipped below its RSI-based moving average at 55.78, a small tell that Monday’s rebound has cooled rather than caught fire. Neither reading is at an overbought or oversold extreme, more a market catching its breath than running out of road.
Why Gold Firmed Up: U.S. – Iran Pause Eases Oil, the Dollar, and Yields

Gold’s firmer tone traces to a weekend pause in hostilities tied to the Middle East conflict. A senior Iranian official told Reuters that Tehran would halt its own strikes as long as Washington did the same, and the pause helped pull oil prices sharply lower in early trading.[2]
Lower energy costs ease the inflation case for tighter US policy, and both the dollar and Treasury yields eased on the news, a combination that has historically supported gold.[2] In fresh gold news, the metal climbed more than one percent in Asian trading, with gold prices briefly above $4,106, before easing back to the current print as some of that early move was trimmed.[3]
The Fed Decision This Week: Hold or a Hike?
Gold’s other storyline this week barely involves gold at all. The Federal Reserve meets on 28 and 29 July under Chair Kevin Warsh, with the target range still at 3.50% to 3.75%.[4] Markets currently lean toward a hold, though CME FedWatch data show a meaningful share still pricing a quarter-point increase, unusual since recent cycles mostly argued over when cuts might land, not whether a hike is next.[5][6]
The decision lands at 2:00pm ET on 29 July (2:00am GMT+8 on 30 July), with Warsh’s press conference following half an hour later.[7] July has no fresh Summary of Economic Projections, so the statement’s own wording is likely to carry more weight than the usual dot plot theatre.[7]
Levels to Watch
The table below covers the zone traders are watching around the current print. These are reference levels, not trade signals, and they sit close to the moving average cluster and last week’s swing points described above.
| Pair | Support | Resistance | What’s Happening |
| XAUUSD | $4,070 / $4,000 | $4,115 / $4,163 | Trading near $4,088, consolidating above the 50- and 200-period moving averages after last week’s round trip |
Table 1: Levels traders are watching as of 04:17 UTC (12:17 GMT+8) on 27 July 2026. Source: the Vantage XAUUSD CFD feed and the TradingView setup used for this analysis. Indicative only.
- FOMC Decision, 29 July: The rate statement and press conference are the main near-term catalyst for gold and the dollar.
- Middle East Developments, Ongoing: Any further easing, or a breakdown in the truce, remains the fastest way this range could break in either direction.
- US PCE Inflation, 30 July: June’s Personal Income and Outlays report, including PCE inflation, is due Thursday at 8:30 a.m. ET.
With gold holding above its moving averages after a volatile week, standard intraday range assumptions carry more risk than usual, and this range has already proven it can move fast. The levels highlighted above provide technical reference points for assessing volatility around the Fed decision, and traders holding correlated positions across gold, the dollar, and oil-linked instruments should check their combined exposure, since a single Middle East headline can move all three at once.
Leverage works both ways in a market this headline-driven, amplifying gains and losses alike, and gold’s own week is a fair reminder of that. Position sizing relative to account equity is worth revisiting ahead of Wednesday’s Fed decision.
RISK WARNING: CFDs are complex financial instruments and carry a high risk of losing money rapidly due to leverage. You should ensure you fully understand the risks involved and carefully consider whether you can afford to take the high risk of losing your money before trading.
Disclaimer: The information is provided for educational purposes only and doesn’t take into account your personal objectives, financial circumstances, or needs. It does not constitute investment advice. We encourage you to seek independent advice if necessary. The information has not been prepared in accordance with legal requirements designed to promote the independence of investment research. No representation or warranty is given as to the accuracy or completeness of any information contained within. This material may contain historical or past performance figures and should not be relied on. Furthermore estimates, forward-looking statements, and forecasts cannot be guaranteed. The information on this site and the products and services offered are not intended for distribution to any person in any country or jurisdiction where such distribution or use would be contrary to local law or regulation.
References
[1] “XAU/USD – Gold Spot US Dollar Price, TradingView chart data” https://www.tradingview.com/symbols/XAUUSD/ Accessed on 27 July 2026.
[2] “Gold rises as hopes for U.S.-Iran diplomacy pause oil rally – CNBC” https://www.cnbc.com/amp/2026/07/21/gold-rises-as-hopes-for-us-iran-diplomacy-pause-oil-rally.html Accessed on 27 July 2026.
[3] “Gold Gains as US-Iran Pause Also Sends Oil Prices Lower – Yahoo Finance” https://finance.yahoo.com/markets/commodities/articles/gold-gains-us-iran-pause-020638716.html Accessed on 27 July 2026.
[4] “FOMC Minutes, June 16-17, 2026 – Federal Reserve” https://www.federalreserve.gov/monetarypolicy/fomcminutes20260617.htm Accessed on 27 July 2026.
[5] “Will the Federal Reserve raise interest rates? Here is what experts predict for July’s meeting – CBS News” https://www.cbsnews.com/news/fed-interest-rate-decision-july-meeting/ Accessed on 27 July 2026.
[6] “A July rate hike from the Fed? The odds are rising – CNBC” https://www.cnbc.com/2026/07/13/-a-july-rate-hike-from-the-fed-the-odds-are-rising.html Accessed on 27 July 2026.
[7] “Meeting calendars and information – Board of Governors of the Federal Reserve System” https://www.federalreserve.gov/monetarypolicy/fomccalendars.htm Accessed on 27 July 2026.
