


[DAILY TRADING] SP500 Analysis 7 July 2026 – Price Holds Near 7,525 Today After Dow’s Record Close

Vantage Editorial Team >
Vantage Editorial Team >
Vantage is a global, multi-asset broker with a team of in-house writers and market analysts who produce educational and insightful trading content for traders of all levels.
 Updated Tue, 2026 July 7 07:43
![[DAILY TRADING] SP500 Analysis 7 July 2026 – Price Holds Near 7,525 Today After Dow’s Record Close](https://www.vantagemarkets.com/wp-content/uploads/2026/06/SP500_banner_900x430_balanced_optimized-2.webp)
SP500 today: the Vantage SP500 CFD traded at 7,524.90, down 2.75 points, or 0.04%, as of the cut-off at 13:12 (GMT+8) / 05:12 (UTC) on 7 July 2026.
The S&P 500 index came into Tuesday’s session just below record territory after Monday’s chip-led rally pushed it to a fresh closing high. The pullback since is small and has not disturbed the broader uptrend.
This is not a trade recommendation. It translates what the SP500 chart and the news are showing as of the cut-off time above, and prices can shift before this piece is read. See all latest SP500 news here.
What the SP500 chart is showing
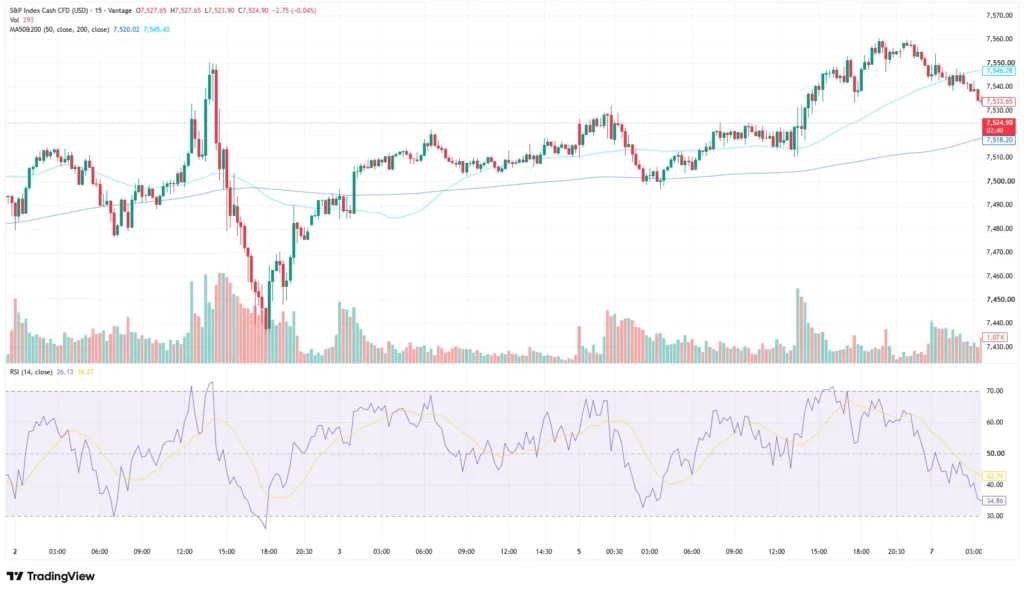
On the 15-minute chart, the Vantage SP500 CFD opened at 7,527.65, reached a high of 7,527.65, dipped to a low of 7,523.90 and traded last at 7,524.90 as of the 02:40 print.[1]
That range sits inside the wider band held since 2 July 2026, when price swung from roughly 7,480 up to 7,555 before settling into the high-7,400s to mid-7,500s zone framing this week.
The 50-period moving average sits at 7,520.02, the 200-period average higher at 7,545.43, attributed to the TradingView setup used for this analysis. Price has spent most of the past two sessions between the two averages, the shorter-term line acting as a floor during Monday’s advance and the longer-term line capping the move near 7,545.
The 14-period Relative Strength Index, also attributed to the TradingView setup used for this analysis, reads 34.86, signal line at 42.79, down from the low-70s reached Monday and now easing toward the lower half of the range without testing oversold below 30.
SP500 news: what’s driving the index today
Monday’s session set the tone. The S&P 500 index gained 0.72% to close at 7,537.43, the Nasdaq added 1.12% to 26,121.16, and the Dow rose 0.29% to a record close of 53,055.91.[2] Chip stocks led, Broadcom extending its custom-chip partnership with Apple through 2031 as the Philadelphia SE Semiconductor Index climbed after two lower sessions.[3] The moves matter beyond CFD traders too, feeding into any S&P 500 index fund tracking the benchmark.
Rate expectations have also shifted. After last week’s cooler-than-expected June jobs report, 57,000 jobs added against a consensus of around 115,000 and unemployment easing to 4.2%, traders have pared back bets on a Fed hike.[4] As of this writing, CME’s FedWatch tool showed around a 24% probability of a 25-basis-point hike at the 29 July 2026 meeting, down from close to 30% a week earlier.[2]
Minutes from June’s FOMC meeting, the first chaired by Kevin Warsh, are due Wednesday, 8 July.[2],[5] Markets are pricing a data-dependent Fed with little forward guidance, leaving the minutes as a watch item rather than a settled outcome.
Away from monetary policy, the temporary 10% Section 122 tariff is due to expire 24 July 2026, with a May US Court of International Trade ruling adding legal uncertainty beyond that date.[5] That keeps trade policy in view for the earnings season starting later this month, with Delta Air Lines and PepsiCo among the first to report.[3]
Check out the stock market news today here!

SP500 price levels traders are watching
The table below sets out the SP500 price zones currently in view. These are reference levels drawn from price structure, not instructions to act.
| Level | Price | What it represents |
| Resistance | 7,545.43 | 200-period moving average; capped the advance into Monday’s session |
| Current price | 7,524.90 | Last traded level on the 15-minute chart as of the cut-off time |
| Support | 7,520.02 | 50-period moving average; has held as a floor through this week’s pullbacks |
| Wider range floor | 7,480 area | Lower boundary of the range price has held since 2 July |
Table 1: Levels as of 7 July 2026, 13:12 (GMT+8) / 05:12 (UTC), drawn from the Vantage SP500 CFD chart. Indicative only.
Price held above the 50-period average through Tuesday’s Asia session, keeping shorter-term structure intact even as RSI cools. A close below that average brings the low-7,500s into view; a push through the 200-period average puts the index near the 7,545 to 7,555 zone that capped price on Sunday night.
What to watch this week
A dense calendar sits between here and the next inflection point for the index:
- FOMC Minutes, 8 July 2026: the record of June’s meeting, the first under Chair Warsh, and the clearest signal yet of the committee’s split on rates.
- US CPI, 14 July 2026: the next inflation print, and a key input into whether the roughly one-in-four odds of a July hike currently priced by CME FedWatch hold, rise or fall.
- Section 122 tariff deadline, 24 July 2026: the scheduled expiry of the temporary 10% blanket tariff, with legal uncertainty from the pending court appeal in the background.
- Q2 earnings season, from mid-July 2026: Delta Air Lines and PepsiCo report first, ahead of a broader push from technology names later in the month.
Volatility risk sits higher than usual into this stretch. With FOMC minutes landing tomorrow and CPI a week after, intraday ranges have room to widen quickly around each release, and Stop Loss placement is worth revisiting since standard daily-range assumptions may not hold on those days.
Any exposure to the SP500 CFD carries leverage, which magnifies both gains and losses and works both ways. Position sizing relative to account equity is worth reviewing ahead of Wednesday’s minutes, particularly for traders holding correlated exposure across US indices and technology-heavy instruments.

RISK WARNING: CFDs are complex financial instruments and carry a high risk of losing money rapidly due to leverage. You should ensure you fully understand the risks involved and carefully consider whether you can afford to take the high risk of losing your money before trading.
Disclaimer: The information is provided for educational purposes only and doesn’t take into account your personal objectives, financial circumstances, or needs. It does not constitute investment advice. We encourage you to seek independent advice if necessary. The information has not been prepared in accordance with legal requirements designed to promote the independence of investment research. No representation or warranty is given as to the accuracy or completeness of any information contained within. This material may contain historical or past performance figures and should not be relied on. Furthermore estimates, forward-looking statements, and forecasts cannot be guaranteed. The information on this site and the products and services offered are not intended for distribution to any person in any country or jurisdiction where such distribution or use would be contrary to local law or regulation.
References
[1] “S&P Index Cash CFD (USD), 15-minute chart” (TradingView, Vantage). Accessed on 7 July 2026.
[2] “S&P 500, Nasdaq gain as chip stocks rebound – Reuters” https://www.marketscreener.com/news/s-p-500-nasdaq-gain-as-chip-stocks-rebound-ce7f5edbd881f020 Accessed on 7 July 2026.
[3] “Stock market news for July 6, 2026 – CNBC” https://www.cnbc.com/2026/07/05/stock-market-today-live-updates.html Accessed on 7 July 2026.
[4] “Dow jumps nearly 600 points to record close – CNBC” https://www.cnbc.com/2026/07/01/stock-market-today-live-updates.html Accessed on 7 July 2026.
[5] “Stock Market Under the Trump Administration: What is Driving Markets in 2026? – U.S. Bank” https://www.usbank.com/investing/financial-perspectives/market-news/stock-market-under-trump.html Accessed on 7 July 2026.
