
 Updated
The ‘Gold vs Silver’ debate has continued to heat up, and considering that they have always been rivals, but in 2026, the debate has shifted. Both metals are moving sharply higher, but for very different reasons. Gold is once again proving itself to be a safe-haven asset, while silver is riding a wave of industrial demand driven by solar panels and electric vehicles.
Through exchange-traded funds (ETFs), investors can access these metals without holding physical bullion. Gold ETFs, such as SPDR Gold Shares (GLD), and silver ETFs, like iShares Silver Trust (SLV), have become some of the most popular ways to gain exposure to these precious metals.
This article will compare their 2025 performance, volatility, and ETF structures, and what to look forward to in 2026. We’ll also highlight how traders in South Africa, where Vantage offers gold and silver trading opportunities, approach this choice in a local context.
Disclaimer: This content is for educational purposes only and does not constitute financial advice.

2025 Gold vs Silver Snapshot
- Gold ETFs continue to attract inflows: GLD now holds approximately $102.5 billion, while iShares IAU has risen to $ 48.4 billion. The World Gold Council reported that global inflows recently reached their strongest half-year since 2010.
- Silver is surging: Prices touched a 13-year high of $35.81/oz, rising 22% year-to-date thanks to booming industrial demand. According to the Silver Institute, 2025 is set to mark the fifth consecutive year of a global silver supply deficit.
- The gold–silver ratio is narrowing: currently around 94, the lowest since 2018. This indicates that silver has been outperforming gold recently. Analysts see this as a shift in relative value.
How Gold and Silver Differ as Investments
Think of gold as that steady friend who never panics; it doesn’t sprint, but it rarely stumbles. That’s why central banks added over 160 tonnes in Q2 2025, according to the World Gold Council. Silver, by contrast, is the high-energy cousin.
It soars when solar panel and EV factory production is booming, as it is right now, but it can also fall twice as fast in a downturn. In 2025, this contrast is sharper than ever: gold is setting records for stability while silver is stealing headlines with its biggest rally in over a decade.
As Aziz Moti, COO of ISA Gold, puts it:
“Clients who secured Krugerrands or gold bars through our platform last July are seeing portfolio gains that outpaced inflation and equities… the price of gold has risen from R 43,700/oz in July 2024 to R 62,200/oz in July 2025, marking an approximate 42% gain.”*
*This is historical data only and does not guarantee future performance.
And on the silver front, Creamer Media reports:
“Silver is emerging as one of 2025’s top-performing precious metals… silver prices hit a 13-year high in June, with the average price for the first half of 2025 climbing 25%.”
Gold: stability and trust
Gold’s appeal lies in its role as a store of value. In times of inflation or financial stress, investors often turn to gold ETFs, such as SPDR Gold Shares (GLD) and iShares Gold Trust (IAU), which collectively hold over $150 billion in assets.
For South African traders, gold has an added relevance — it has historically moved in the opposite direction of the rand, often serving as a buffer when the local currency weakens.
If you want to understand the mechanics, see our Complete Trader’s Guide to Gold and Silver ETFs.
Silver: growth and volatility
Silver is different. More than 50% of its demand now comes from industry — especially solar energy, electric vehicles, and electronics. The Silver Institute projects another supply deficit in 2025, and prices have already hit $35.81/oz, their highest since 2011.
That’s why investors consider silver ETFs for growth exposure, such as the iShares Silver Trust (SLV), but this depends on individual risk profiles and should not be taken as investment advice.
But silver’s strength is also its risk: it’s twice as volatile as gold. It can double during a boom — but fall just as sharply when demand eases. For more context, please refer to our Metals Trading Overview.
Inflation hedge vs growth bet
- Gold = inflation hedge. Protects wealth in uncertain times.
- Silver = growth bet. Thrives when industry and technology are expanding.
- Both together = balance. A portfolio that includes both metals provides steady insurance from gold and potential upside from silver.
Investor scenarios in 2025
- Facing recession risk? Gold ETFs have often been viewed as a cushion.
- Expecting a clean energy boom? Silver ETFs have historically captured some of that upside.
- Want to balance risk? Holding both metals has historically provided diversification benefits.
For South Africans, timing also matters. Liquidity is highest during the London–New York overlap, and rand moves can amplify or soften USD-denominated returns. For timing insights, see our Best Time to Trade Forex.
Inflation hedge vs growth play
- Gold = Hedge: Protects wealth during inflation and crises.
- Silver = Growth proxy: Rides global manufacturing and green tech cycles.
- Together: A mix of both can balance defensive and growth exposure.
Historical contrasts
- 2008 Financial Crisis: Gold rallied, silver lagged.
- 2011 Commodity Boom: Silver surged above $48/oz, far outpacing gold.
- 2020 Pandemic Crash: Gold steadied portfolios; silver fell hard but bounced back stronger.
- 2025 Clean Energy Boom: Gold rose on central bank demand, while silver surged due to industrial use.
Investor scenarios in 2025
- Recession risk: Gold ETFs are often viewed as a stable option by market participants.
- Industrial boom: Silver ETFs may outperform, though with more volatility.
- Balanced portfolio: Combining both metals reduces the risk of missing out on opportunities.
Timing and the Rand
For South African traders, timing and the ZAR/USD exchange rate add an extra layer of complexity. Gold and silver ETFs trade most actively during the overlap of the London and New York sessions, thereby improving liquidity. But random strength or weakness can offset part of the USD metal move. For timing insights, see Best Time to Trade Forex in South Africa.
| Feature | Gold | Silver |
| Personality | Steady friend, rarely stumbles | High-energy cousin, exciting but risky |
| Role | Store of value, hedge | Precious + industrial growth driver |
| Volatility | Lower, more predictable | Higher amplifies gold’s moves |
| Best for | Conservative, long-term investors | Aggressive traders chasing upside |
The 2025 Macro Backdrop: What’s Driving Gold and Silver
To understand why gold and silver are moving the way they are in 2025, you can’t just look at the charts. You need to step back and take a broader view. These metals are shaped by interest rates, inflation, the U.S. dollar, global politics, and even the clean energy revolution.
1. Interest rates and central banks
When interest rates rise, investors often prefer assets that yield a higher return. Usually, this would put pressure on gold. But 2025 has been different. Despite high global rates, central banks have been buying gold in record amounts, adding 166 tonnes in Q2 2025 alone, according to recent data from the World Gold Council. This shows that trust in gold as a reserve asset remains unshaken.
Silver doesn’t respond directly to interest rates. However, when central banks accumulate gold, it often pulls silver along, as investors perceive broader demand for precious metals.
2. From rates to inflation
Rates tell only part of the story. To see why investors are still flocking to metals, you have to look at inflation. Gold has always been the classic inflation hedge. In 2025, persistent price pressures have pushed more money into gold ETFs, with SPDR Gold Shares (GLD) reporting some of its strongest inflows since 2010.
For silver, inflation has a different effect. Rising costs are accelerating investment in renewable energy and electric vehicles, both of which rely heavily on silver. That makes silver a unique way to play the inflation story through the industry.
3. From inflation to the U.S. dollar
Inflation shapes local buying power, but on the global stage, the U.S. dollar sets the tone. In 2025, the dollar has weakened against major currencies, providing both metals with room to rally. When the dollar falls, gold and silver look cheaper to international buyers, which lifts demand worldwide.
For South African traders, the picture is even more layered. Rand movements against the dollar can either amplify or mute gains. This is why metals are often treated locally as both a global play and a rand hedge. See our ‘Best Time to Trade Forex in South Africa‘ to understand how timing overlaps affect ZAR/USD movements.
4. From currencies to politics
Currency shifts matter, but politics can be just as powerful. In 2025, ongoing wars, global elections, and trade disputes have bolstered gold’s reputation as a geopolitical hedge. Silver doesn’t share the same safe-haven appeal, but it often follows gold whenever risk sentiment changes.
5. From fear to optimism: the clean energy story
Not all demand comes from fear. Silver is also being pulled higher by optimism. Solar installations and EV production are booming globally, and silver is a critical input in both. The Silver Institute reports that industrial demand is at record highs and is expected to keep the market in deficit for the fifth consecutive year. Gold benefits too, but silver is the one directly riding this green energy wave.
For a broader view of commodities, see our commodities trading overview.
Pulling it all together
Together, these forces explain why both metals are rising in 2025, though for very different reasons. Gold is thriving on caution, driven by central bank buying, inflation concerns, and geopolitical risk. Silver is thriving on ambition, driven by industrial growth, a weaker dollar, and the clean energy boom.
Performance Review: Gold vs Silver, 2023–2025
Gold and silver have both delivered strong returns in recent years, but they’ve done so in very different ways. Examining performance from 2023 through mid-2025 reveals not only which metal has gained more, but also how they behaved under pressure.
Gold’s steady climb
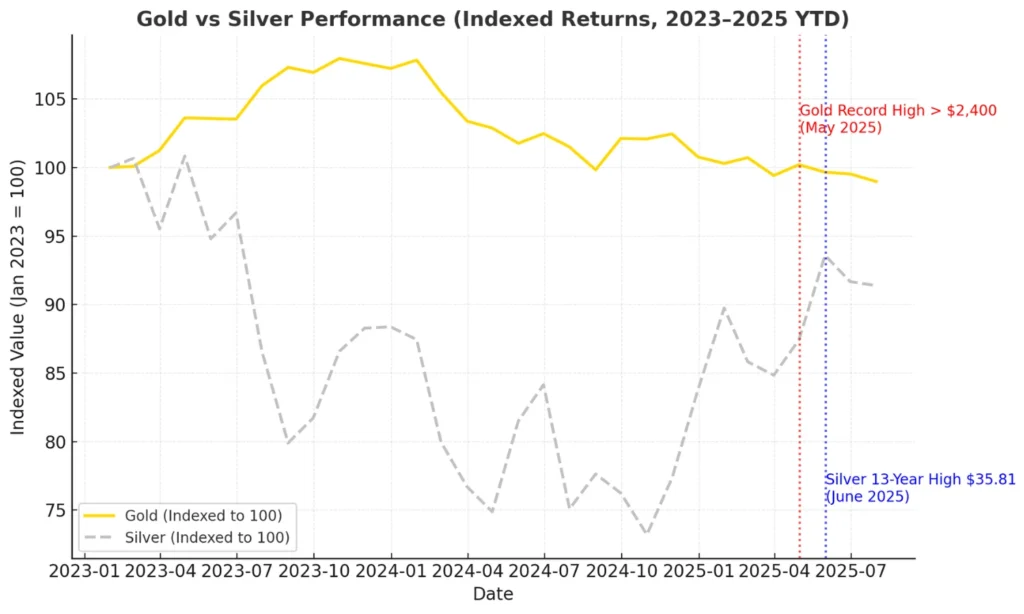
Gold has taken the slow-and-steady route. In May 2025, it crossed $2,400/oz for the first time in history, before settling slightly lower in June (CNBC). Since early 2023, gold has increased by approximately 28%, comfortably outperforming global bonds and matching the returns of major equity indices.
What stands out is the consistency. Gold tends to move in narrower daily ranges than silver. Its annualised volatility is around 15%, compared to silver’s 30%. In practice, this means gold investors experience milder price fluctuations, making it easier to hold onto their investments during periods of uncertainty. But while gold reassures with stability, silver excites with speed.
Silver’s powerful surge
Silver has been the headline-maker of 2025. In June, it jumped to $35.81/oz, its highest level in 13 years, according to MarketWatch data, gaining 22% YTD. That surge was driven by record industrial demand from solar and EV manufacturing, alongside investor flows into ETFs such as iShares Silver Trust (SLV).
But silver’s edge is also its weakness: volatility. Daily moves of 2–3% are standard, and during corrections, silver often falls twice as fast as gold. Its Sharpe ratio (a measure of risk-adjusted returns) has historically been lower than gold’s, meaning the journey is bumpier even if the upside is higher.
Analysis:
The chart highlights the contrast between the two metals. Gold has moved higher in a calm, consistent fashion, climbing nearly 28% since early 2023 and setting a new record above $2,400 in May 2025 (CNBC). Silver, on the other hand, has taken a more volatile path. It lagged behind gold for parts of 2023 but surged to $35.81/oz in June 2025, its highest level in 13 years, according to MarketWatch data.
For investors, the lesson is simple: gold has historically been perceived as more stable, while silver offers bigger bursts of upside but with sharper pullbacks, but market conditions can change In South Africa, where the rand’s volatility adds another layer, this difference can be even more pronounced — making timing and risk tolerance key factors when choosing between gold and silver ETFs.
The gold–silver ratio: silver catching up
Professionals often track the gold–silver ratio — how many ounces of silver equal one ounce of gold. In 2023, the ratio exceeded 100, making silver appear historically cheap. By mid-2025, it had fallen to about 94, the lowest since 2018.
This shift indicates that silver has been narrowing the gap, driven by industrial buyers. Traders sometimes view a falling ratio as a sign silver is in favour — though it’s no guarantee the trend will last.
A longer timeline of contrasts
- In the 1970s, gold outpaced silver as investors sought safety from runaway inflation.
- The 2008 financial crisis: Gold rallied as equities crashed, while silver lagged.
- 2011 commodity boom: Silver spiked above $48/oz, far outpacing gold before collapsing.
- The 2020 pandemic: Gold steadied portfolios, while silver plunged and then staged a furious rebound.
- 2025 clean energy cycle: Gold is thriving on central bank demand; silver is surging on industrial growth.
This pattern shows that gold shines in crises, while silver thrives in booms—a difference that repeats itself.
Investor personas: who fits where?
- The conservative investor: Checks the portfolio monthly and dislikes surprises. Gold ETFs, such as GLD or IAU, are often viewed by market participants as offering stability and deep liquidity.
- The aggressive investor: Loves momentum trades, accepts big swings. Silver ETFs, such as SLV, are commonly used by traders seeking higher volatility.
- The balanced investor: Wants exposure to both crisis hedges and growth themes. Some traders use a mix of gold and silver to balance different market dynamics, but this is not investment advice
For South Africans, there’s another dimension: the rand.
South Africa angle: the rand effect
Gold is deeply woven into South Africa’s history as a top producer, so many local investors instinctively trust it. However, for ETF traders, the ZAR/USD exchange rate adds another layer of complexity. When the rand strengthens, dollar-denominated gold and silver ETFs may deliver smaller local gains. When the rand weakens, metals can look even more attractive as a hedge.
This makes timing crucial. Liquidity is strongest during the London–New York overlap, when global ETFs trade at their tightest spreads. For practical execution tips, see our guide on the Best Time to Trade Forex in South Africa.
Silver ETF Deep-Dive (2025)
Silver’s 2025 rally has drawn global attention, and South African investors are no exception. Two ETFs dominate the market: iShares Silver Trust (SLV) and Aberdeen Standard Physical Silver Shares ETF (SIVR).
iShares Silver Trust (SLV) – The Market Leader
SLV is the world’s largest silver ETF with $13.5 billion AUM. It trades more than 40 million shares a day, making it the most liquid option for traders.
- Expense ratio: 0.50% (ETFdb)
- Performance 2025: Up ~22% YTD, matching silver’s surge to a 13-year high (MarketWatch).
- Spreads: Extremely tight (~0.03%).
- Often considered suitable for: Active traders and institutions that require liquidity above all else.
Aberdeen Standard Physical Silver Shares ETF (SIVR) – The Cost-Saver
- SIVR offers the same physical silver exposure at a lower cost.
- AUM: About $1 billion in 2025.
- Expense ratio: 0.30%.
- Performance 2025: Tracks silver spot closely, with slightly better net returns due to lower fees.
- Spreads: Wider than SLV (~0.08%), but manageable for long-term investors.
- Best suited for: Cost-conscious investors seeking to gradually build silver exposure.
Visual Comparison
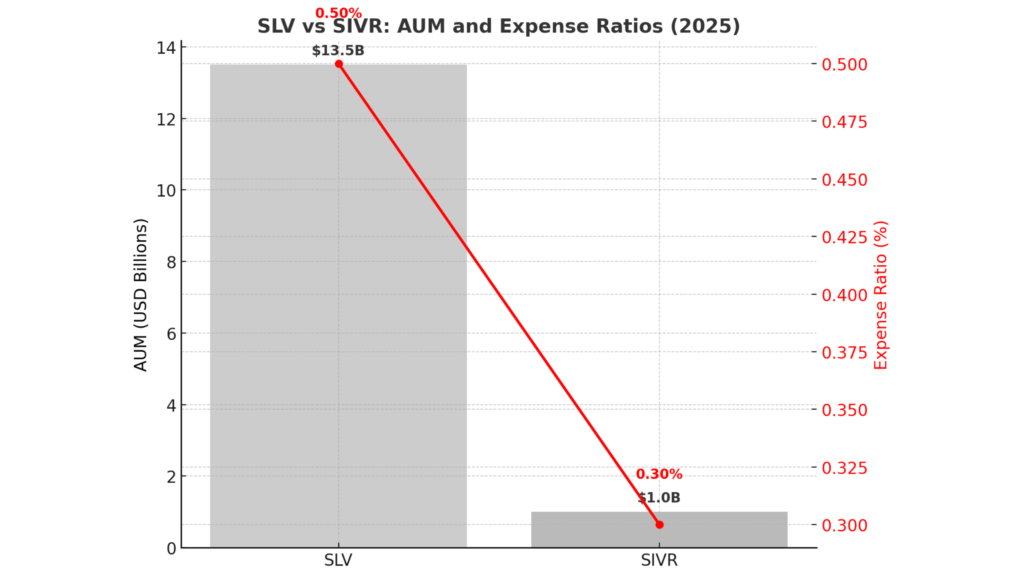
SLV dominates in scale, with more than $13.5 billion under management, while SIVR is smaller, at $1 billion, but charges lower fees. The red line shows that SIVR’s expense ratio (0.30%) is lower than SLV’s 0.50%, making it more cost-efficient for long-term investors.
Analysis:
This comparison highlights the trade-off between liquidity and cost. SLV is the clear giant; its massive size and over $1 billion in daily trading volume provide it with unmatched liquidity, which suits short-term traders and institutions. But size comes at a price: its higher 0.50% fee eats into returns over time. SIVR, although smaller, offers a lower expense ratio of 0.30%, making it more suitable for cost-sensitive, long-term investors.
For South African investors, both funds provide exposure to silver’s 2025 rally; however, the decision often comes down to how frequently you trade. If you trade frequently, SLV’s liquidity is more important. If you’re investing for years, SIVR’s lower fees add up in your favour.
South African analysts are also noticing the surge in silver. As Vega Asset Management commented in their August 2025 market note:
“Silver has delivered an impressive 27% return year-to-date,” reflecting its dual role as an industrial growth driver and a store of value during periods of global uncertainty.
Risks to Know
- Volatility: Silver is twice as volatile as gold; ETFs can swing sharply.
- Industrial exposure: Over 50% of demand comes from solar and EVs; if growth slows, prices can drop (Silver Institute).
- Fees vs. liquidity: SLV is pricier but highly liquid; SIVR is cheaper but less liquid.
- Currency risk: For South Africans, the rand’s movement against the US dollar can magnify or mitigate returns
Which ETF Fits Which Investor?
| Investor Type | Best ETF | Why it Fits |
| Ative Trader | SLV | Massive liquidity, tight spreads |
| Active Trader | SIVR | Low fees, efficient for compounding |
| South African rand Hedger | Either | Metals hedge currency swings; timing is key |
Other Silver ETF Options (Worth Noting)
While SLV and SIVR dominate, other ETFs exist:
- ProShares Ultra Silver (AGQ): A leveraged fund — magnifies silver’s moves (higher risk).
- Global X Silver Miners ETF (SIL): Tracks mining companies, not physical silver (adds equity risk).
These are specialised tools, not core holdings.
Gold vs Silver: South African Angle
Silver ETFs enable South Africans to tap into the clean energy boom without holding physical bullion. However, the ZAR/USD exchange rate is crucial; a strong rand may erode USD gains, while a weaker rand can amplify them. Liquidity is highest during the London–New York overlap, which coincides with the period when silver trades most actively worldwide.
👉 For timing strategies, see our Best Time to Trade Forex in South Africa.
Gold vs Silver: Volatility, Drawdowns, and Risk (2025)
If gold is the steady friend and silver the high-energy cousin, their differences really show up when you look at volatility and drawdowns. Both metals have delivered gains in 2025, but the journey has been very different.
Gold: Calm in the storm
- 2025 annualised volatility: ~13%
- Max drawdown YTD: −6%
- Behaviour: Gold has absorbed market stress with limited daily swings (rarely more than ±2%).
- Impact: This stability makes gold easier to hold through crises; investors aren’t forced into panic selling.
Silver: Higher energy, higher risk
- 2025 annualised volatility: ~28%
- Max drawdown YTD: −14%
- Behaviour: Silver regularly posts ±5% daily moves, double gold’s range.
- Impact: Great for aggressive traders chasing upside, but it can punish those with weak nerves
As one silver investor put it on Reddit:
“It’s not supposed to. It’s a hedge against inflation, not a get-rich-quick scheme. With silver, a five or $10 increase in a year is a good year.”
— Comment from r/SilverDegenClub.
This candid remark captures the reality: silver can shine, but investors must manage expectations and risk appetite.
The following statements represent informal investor opinions shared on social media and are for educational purposes only. They do not constitute financial advice or endorsement by Vantage.
Chart 1: Volatility and Drawdowns (2025 YTD)
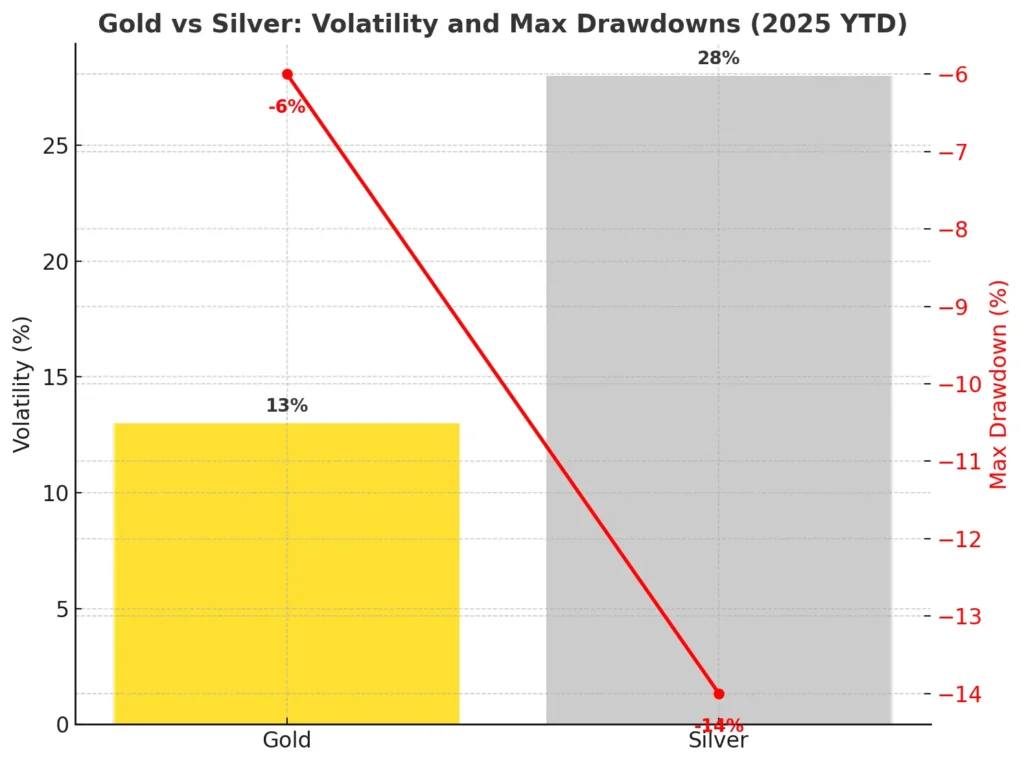
- Bars show annualised volatility (Gold ~13% vs Silver ~28%).
- Red markers indicate maximum drawdowns (Gold: −6% vs. Silver: −14%).
- Lesson: silver doubles the risk profile of gold, which explains why many traders say it feels like “gold on steroids.”
Risk Comparison Table
| Metric | Gold | Silver |
| Annualised Volatility (2025 YTD | ~13% | ~28% |
| Max Drawdown (2025) | −6% | −14% |
| Typical Daily Swing | ±2% | ±5% |
Chart 2: Daily Return Distribution (2025 YTD)
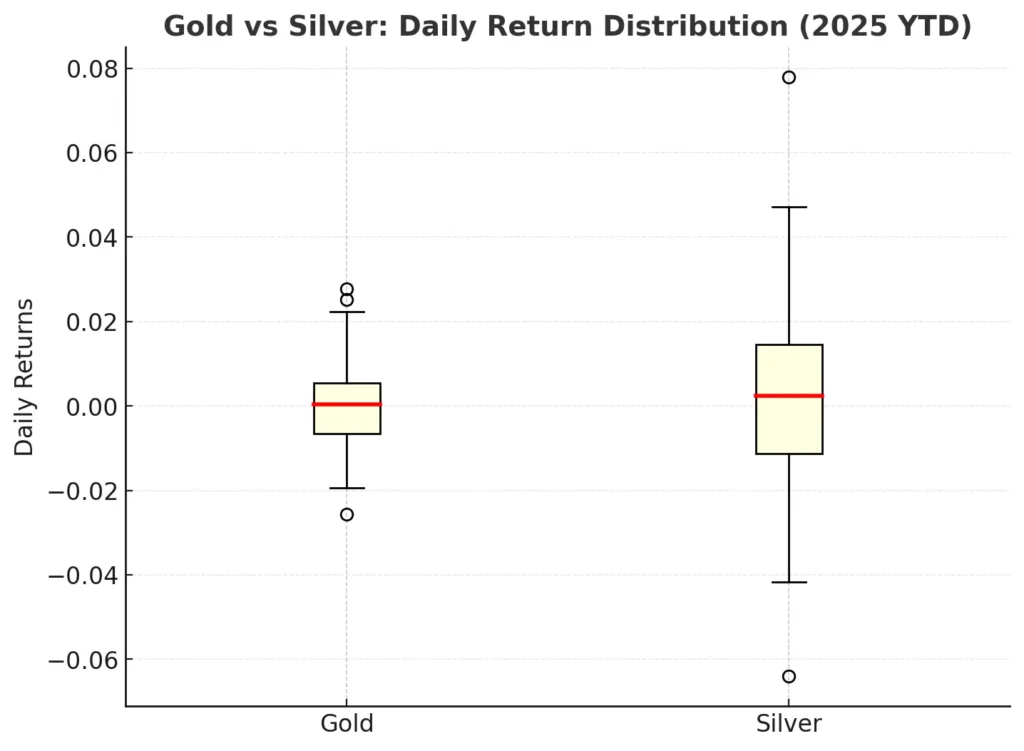
- Gold’s returns cluster tightly, showing a narrow, predictable range.
- Silver’s distribution has “fatter tails,” meaning larger outliers in both directions.
- Lesson: Silver’s path is wilder; it can double quickly, but with sharper falls along the way.
Historical context
- 2008: Gold fell ~30% then rallied; silver dropped 50%.
- 2011: Silver spiked above $48/oz, then collapsed by 45%.
- During the 2020 pandemic, gold dipped 12% but recovered, while silver fell 35% before rebounding.
- 2025 so far: Gold remains a calm hedge; silver is back to rollercoaster mode.
Investor Personas (Risk Lens)
- Safety-first Saver: Chooses gold ETFs — lower stress, steady store of value.
- Adrenaline Chaser: Chooses silver ETFs — accepts volatility for upside.
- Balanced Builder: Holds both — gold to steady the ride, silver for bursts of growth.
Risks to Keep in Mind
- Leverage ETFs: Products like ProShares Ultra Silver (AGQ) can magnify both gains and losses.
- Liquidity gaps: Silver spreads widen outside peak hours.
- Currency risk for South Africans: ZAR/USD swings can further amplify volatility.
👉 For practical execution, see our Best Time to Trade Forex in South Africa.
👉 To understand why volatility doesn’t negate gold’s appeal, check Gold as an Inflation Hedge.
The Bottom Line
- Gold: Lower risk, smoother ride, crisis-proof.
- Silver: Higher risk, bigger swings, growth-linked.
- Together, they balance each other; gold calms the waves, silver powers the surges.
Timing Tools Every Trader Should Use
Knowing what to trade is one thing, but knowing when to trade gold and silver is what separates consistent profits from frustrating losses. Timing matters because liquidity and volatility change across the trading day.
1. Trading Session Overlaps: The Sweet Spot
The London–New York overlap is the most critical window for metals trading:
- GMT: 13:00–16:00
- SAST (South Africa): 15:00–18:00
Why it matters: This is when major institutions in both Europe and the U.S. are active, resulting in the tightest spreads and the most significant intraday moves.
Chart 1: Gold vs Silver Intraday Liquidity Curve (2025 Typical Pattern)
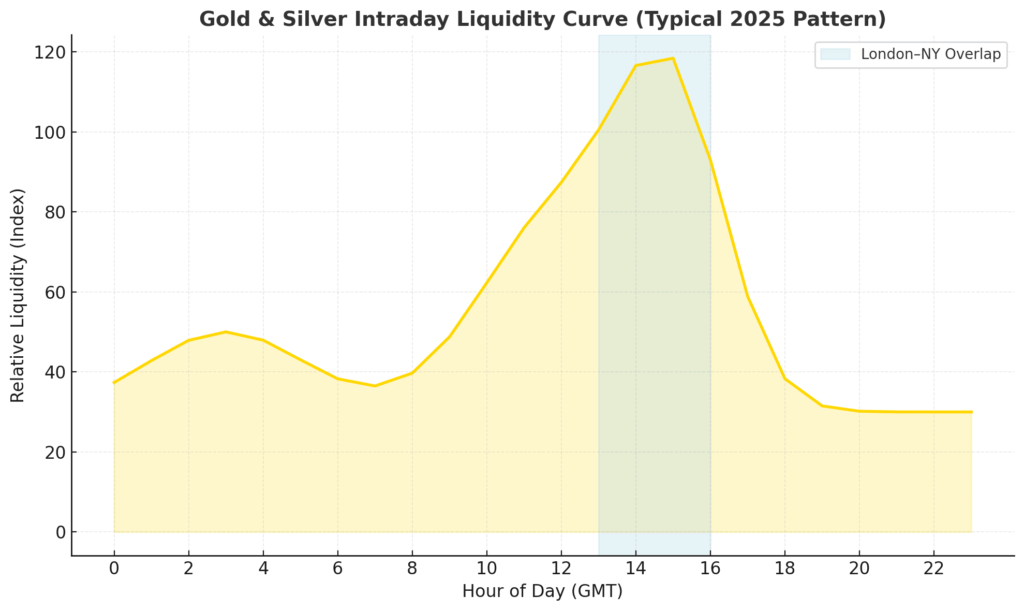
- Liquidity rises steadily from Asia, spikes during the London session, and peaks sharply in the London–NY overlap.
- For South Africans, this overlap happens after work hours, making it highly practical for retail traders.
2. Use Volatility Indicators to your advantage
Timing isn’t just about clock hours; it’s also about knowing when volatility is supportive.
| Tool | What it Measures | How to Apply It |
| ATR (Average True Range) | Average size of candles | Scalpers watch rising ATR on 15-minute charts to catch breakouts. Swing traders use it on daily charts to size stops. |
| Economic Calendar | Scheduled market movers | Watch CPI, NFP, and Fed rate decisions; they typically have the greatest impact during the overlap window. |
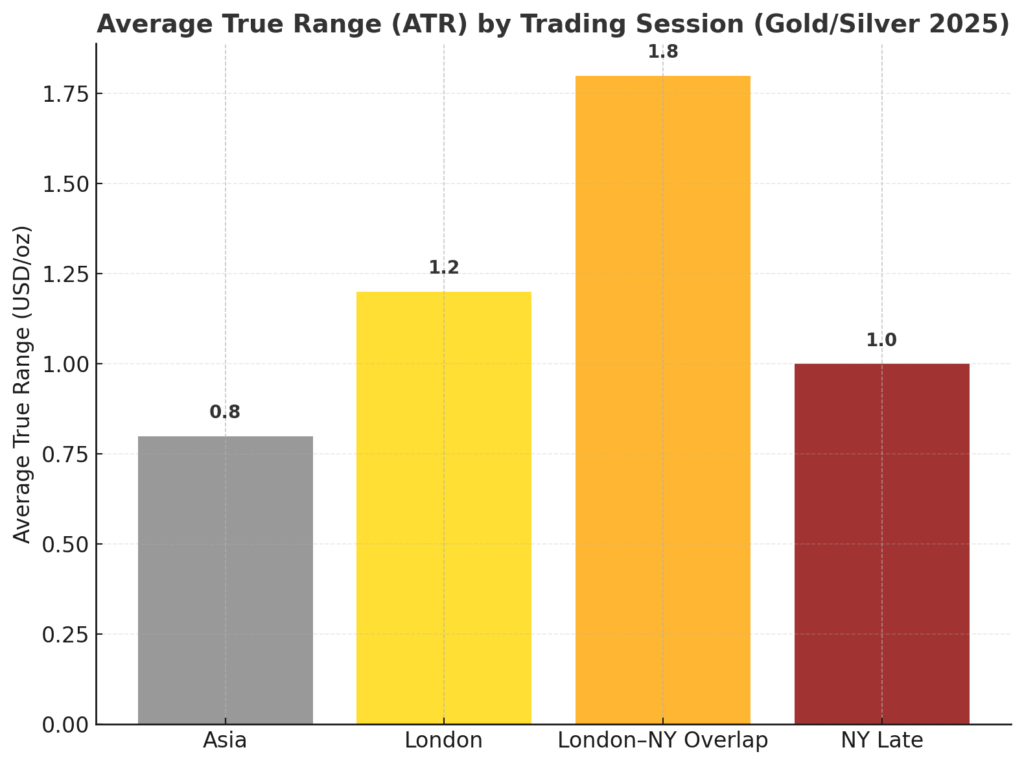
Chart 2: ATR by Trading Session (2025)
ATR is lowest in Asia, rises in London, and peaks at the overlap, making it perfect for breakout trades.
3. Economic Events That Move ‘Gold vs Silver’ Most
The table below shows how certain data points cause metals to vibrate more than others.
| Event | Why it matters | Impact |
| U.S. CPI(Inflation) | Gold is the inflation hedge | Big directional move |
| U.S. Non-farm Payroll(NFP) | Market-wide volatility | Spikes in metals |
| Fed rate Decisions | Rates vs gold inverse link | Multi-session trends |
| Geopolitical Shocks | Risk-off flows | Sudden safe-haven bids |
| Central Bank Buying Reports | Signal demand strength | Long-term trend support |
4. Real-Trader Wisdom from Reddit
Choosing the right time matters. The London–New York overlap (GMT 13:00–16:00 / SAST 15:00–18:00) is where gold and silver markets get most alive, spreads shrink, liquidity spikes, and big moves happen. As one Reddit trader puts it:
“The NYC‑LDN overlap is The Mother Of All Trading Periods. A large percentage of my most successful trades have been placed in that zone.”^
This underscores the overlap as a sweet spot, especially for South African traders tuning in after work.
The statements represent informal investor opinions shared on social media and are for educational purposes only. They do not constitute financial advice or endorsement by Vantage Markets
Investor Personas (Timing Lens)
- The Session Guard: Watches London open (SAST 9:00–11:00) for trend setups.
- The Informed Swing Player: Aligns trades with CPI/Fed announcements during overlap
Bottom Line
- Trade between London and other markets overlaps to optimise liquidity.
- Pair timing with volatility tools (ATR + economic calendar).
- South Africans have an edge: the best trading window aligns with late afternoon.
- Always combine timing with risk management, since events can cut both ways.
Worst Time to Trade Gold vs Silver (and Why I Avoid It)
The worst time to trade gold and silver is not just about “quiet hours.” It’s about when liquidity thins, spreads widen, and moves turn deceptive.
1) The Asian session lull: thin markets, wider spreads
Between 22:00–06:00 GMT (00:00–08:00 SAST), trading is dominated by the Sydney and Tokyo sessions. During this time, metals often drift with false breakouts that reverse once London opens. Liquidity is thin, and bid–ask spreads widen, making execution costly.
As Investopedia notes, Asian-session price action is typically range-bound, while volume surges when the European session begins. That’s why traders are better off waiting for the London–New York overlap, where liquidity is deepest. See our complete Forex timing guide for South Africa.
2) Right after major news: the whipsaw trap
Events like U.S. Nonfarm Payrolls (NFP), CPI inflation data, and Federal Reserve rate decisions often trigger significant spikes. But the first few minutes after release are notorious for spread blowouts and slippage. Unless you’re algo-driven, it’s usually wiser to wait 5–15 minutes for spreads to normalise.
Case Study – The NFP Whipsaw (July 2025):
On July 3, 2025, the U.S. NFP report showed just 73,000 jobs added, far below forecasts. Gold surged nearly 2% to $3,350/oz, then collapsed almost as quickly. It was a textbook whipsaw, captured in FXStreet’s weekly gold forecast, proof of why entering trades in those first minutes is so risky.
3) Late New York fade: when liquidity dies
From 20:00–23:00 GMT (22:00–01:00 SAST), U.S. desks close and Asia hasn’t woken up yet. Liquidity drains, spreads creep wider, and markets turn choppy.
As one trader on Reddit’s r/Forex puts it:
“I trade whenever I feel like it. Except around closing/opening times. Can’t deal with the insane spreads.”^
Their frustration echoes what most professionals already know: late-NY hours are best avoided.
The above statement represents informal investor opinions shared on social media and is for educational purposes only. They do not constitute financial advice or endorsement by Vantage Markets.
Chart: Spreads widen in low-liquidity hours
| Session/Time(GMT) | Liquidity | Risk Level | What to Expect |
| London- NY Overlap(12:00 – 16:00 Summer/Winter 13:00 – 17:00 | Highest | Lower | Tight spreads, directional moves |
| Asian(22:00 – 6:00) | Weak | Higher | Thin market. False breakout |
| Late New York Session(20:00 – 23:00 ) | Weak | Higher | Liquidity fade; spread creep |
| Immediately after CPI/NFP/Fed | Distorted | Higher | Spikes + whipsaw; wait 5 – 15 minutes |
South African context
For South Africans, the worst windows are doubly inconvenient:
- The Asian lull plays out while most are asleep.
- The late New York fade typically occurs around midnight hours.
By contrast, the London–New York overlap (14:00–18:00 SAST) is not only the most liquid window but also perfectly aligned with late-afternoon trading, a rare case where global markets and local time zones align.
Bottom line
The worst times to trade gold and silver are:
- During the Asian session lull.
- The late New York fade.
- The first minutes after major news releases.
Avoiding these hours is as crucial as knowing the best ones. For a more comprehensive understanding of timing strategies, refer to our guide on the best times to trade gold and silver.
FAQs: Best Time to Trade Gold vs Silver [Expert Edition]
What is the best time to trade gold in South Africa?
The best time is during the London–New York overlap, roughly 14:00–18:00 SAST in summer (12:00–16:00 GMT). This is when liquidity is deepest, spreads are tightest, and news from both Europe and the U.S. hits the wires.
According to Investopedia, more than 50% of daily forex volume flows through this overlap. We’ve covered this in detail in our South Africa forex timing guide
Is it bad to trade gold during the Asian session?
Yes. Between 22:00–06:00 GMT (00:00–08:00 SAST), metals usually drift sideways with thin liquidity. This means wider spreads and false breakouts. As one trader put it on Reddit’s r/Forex:
“The moves are fake, the liquidity is thin, and the real action only starts when London opens.”
The statement above represents informal investor opinions shared on social media and is for educational purposes only. They do not constitute financial advice or endorsement by Vantage.
Why does gold move so much after CPI and NFP?
Because these releases are macro catalysts, gold is sensitive to inflation (CPI) and jobs (NFP), as both shape Federal Reserve policy. For example, after the July 2025 NFP miss (only 73,000 jobs), gold spiked nearly 2% before reversing, a whipsaw captured in FXStreet’s forecast. That’s why most professionals wait a few minutes after release before trading.
Is silver riskier to trade than gold?
Yes. Silver is about twice as volatile as gold. Its annualised volatility runs ~28% vs gold’s 13% (2025 data). Silver’s demand is also industrial (solar, EVs), so price swings are sharper. That said, silver ETFs such as SLV and SIVR make it easier to access, though traders must accept more volatile intraday price movements.
What is the worst time to trade Gold vs Silver?
The worst times are:
- The Asian session lull (22:00–06:00 GMT).
- Late New York hours (20:00–23:00 GMT).
- Minutes immediately following major news releases, such as NFP or CPI.
These periods have thin liquidity and wider spreads. We break this down entirely in our worst-time guide.
Can South Africans trade gold vs silver after work?
Yes. The good news is that the London–New York overlap aligns perfectly with 15:00–18:00 SAST, which is after office hours. That’s why many South African traders focus on this window. Brokers like Vantage offer access to gold and silver CFDs that can be traded during this session.
Is gold really a hedge against inflation?
Historically, yes. Gold has preserved purchasing power during high-inflation decades. However, it’s not a straight line; there are years when gold underperforms even as inflation runs high. For more nuance, check our full breakdown in Gold as an Inflation Hedge and the World Gold Council’s research.
Final Thoughts from an 18-Year Veteran: Trade Less, Win More
After nearly two decades of trading gold and silver ETFs, the lesson is simple: timing matters, but discipline matters more.
Gold remains the calmer hedge. It doesn’t deliver fireworks daily, but it protects wealth when inflation or crises hit. Silver, on the other hand, is twice as volatile, capable of explosive rallies but just as capable of sudden drops. Both are valuable, but neither forgives reckless trading.
Why Less Is More
Most successful trades don’t happen at midnight or during thin Asian hours. They happen in just a few hours a day — the London–New York overlap. For South Africans, that’s conveniently 14:00–18:00 SAST, right after work. This is the optimal time to trade gold and silver, as liquidity peaks, spreads tighten, and trends become clearer. As Investopedia confirms, this overlap consistently accounts for the largest share of daily trading volume.
Gold vs Silver: Which Is Better?
If your goal is stability, gold is the better fit. If you’re looking for higher risk and growth potential, silver may be an appealing option. The smartest portfolios usually hold both: gold to calm the ride, silver to power growth. This approach has been the standard for both professional traders and central banks. You can read more in our complete guide to trading gold and silver ETFs.
The Mindset That Wins
Trading is less about predicting every tick and more about:
- Timing trades when liquidity is deepest.
- Respecting volatility — especially in silver.
- Letting bad windows pass.
As I often tell new traders, the market pays the disciplined, not the desperate. Trade less, but trade smarter, and the wins will compound over time.
RISK WARNING: CFDs are complex financial instruments and carry a high risk of losing money rapidly due to leverage. You should ensure you fully understand the risks involved and carefully consider whether you can afford to take the high risk of losing your money before trading.
Disclaimer: The information is provided for educational purposes only and doesn’t take into account your personal objectives, financial circumstances, or needs. It does not constitute investment advice. Mention of ETFs such as GLD, SLV, or SIVR is for educational illustration only and should not be considered a recommendation to buy or sell any security.
We encourage you to seek independent advice if necessary. The information has not been prepared in accordance with legal requirements designed to promote the independence of investment research.
No representation or warranty is given as to the accuracy or completeness of any information contained within. This material may contain historical or past performance figures and should not be relied on. Furthermore, estimates, forward-looking statements, and forecasts cannot be guaranteed.
The information on this site and the products and services offered are not intended for distribution to any person in any country or jurisdiction where such distribution or use would be contrary to local law or regulation.
References
-
‘Silver prices just hit a 13-year high. More gains could be on the way’ – https://www.marketwatch.com/story/silver-prices-just-hit-a-13-year-high-more-gains-could-be-on-the-way-de4fa0e7
-
‘iShares Silver Trust’ – https://etfdb.com/etf/SLV/#etf-ticker-profile
- ‘August 2025 Newsletter’ – https://vegaassetmanagement.co.za/2025/08/05/august-2025-newslet
- ‘iShares Silver Trust’ – https://www.ishares.com/us/products/239855/ishares-silver-trust-fund/
- ‘Weekly Gold Price Forecast: NFP Miss Fuels Breakout, Eyes on $3,472’ – https://www.fxleaders.com/news/2025/08/03/weekly-gold-price-forecast-nfp-miss-fuels-breakout-eyes-on-3472/
- ‘The Effect of Fed Funds Rate Hikes on Gold’ – https://www.investopedia.com/articles/investing/100915/effect-fed-fund-rate-hikes-gold.asp/
- ‘Global Silver Market Forecast to Remain in a Sizeable Deficit in 2025’ – https://silverinstitute.org/global-silver-market-forecast-to-remain-in-a-sizeable-deficit-in-2025/