
 Register
 Login
Login Register


ASX Under Pressure as Gold and Oil Climb on Middle East Tensions

Vantage Editorial Team >
Market Analyst
Vantage Editorial Team >
Market Analyst
 Updated Wed, 2026 July 8 05:41

Investor sentiment remained cautious as renewed selling in US semiconductor stocks, escalating US-Iran tensions, and higher oil prices weighed on global markets.
Overnight, the Nasdaq led declines, falling 1.16%, while the S&P 500 and Dow Jones also finished lower as investors reduced exposure to technology stocks. US Treasury yields were little changed as markets awaited further signals on the outlook for US interest rates.
Gold traded around US$4,100 per ounce, supported by increased safe-haven demand amid ongoing geopolitical tensions in the Middle East. Oil prices also moved higher following renewed attacks involving commercial vessels in the Strait of Hormuz and subsequent US strikes on Iranian targets, adding to concerns over potential supply disruptions.
Looking ahead, attention will turn to the release of the Federal Reserve’s June FOMC meeting minutes, which may provide additional insight into the central bank’s policy outlook. Investors will also be monitoring US Initial Jobless Claims on Thursday for an updated reading on labour market conditions, while the US earnings season begins to gather pace with several major companies scheduled to report later this week.
This week’s technical review focuses on three key markets: Gold, the Nasdaq 100 and Bitcoin.
Gold: Testing the key support zone at $4,090-$4,100.
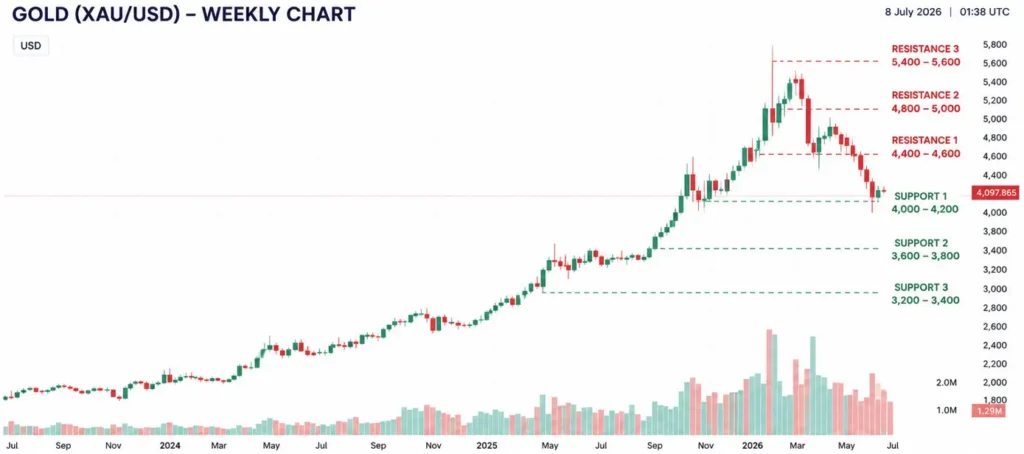
Gold (XAU/USD) is trading around the US$4,100 area on the weekly chart, with price consolidating following the recent pullback from the record highs reached earlier this year.
The US$4,000–4,200 region represents the nearest area of support, while resistance is identified between US$4,400–4,600, followed by US$4,800–5,000 and US$5,400–5,600.
The weekly chart continues to reflect a period of consolidation after the recent advance, with price currently trading between established support and resistance levels. Market participants are likely to monitor these technical areas as longer-term price action continues to develop.
Nasdaq100: Remains below its recent highs due to recent weakness in technology.
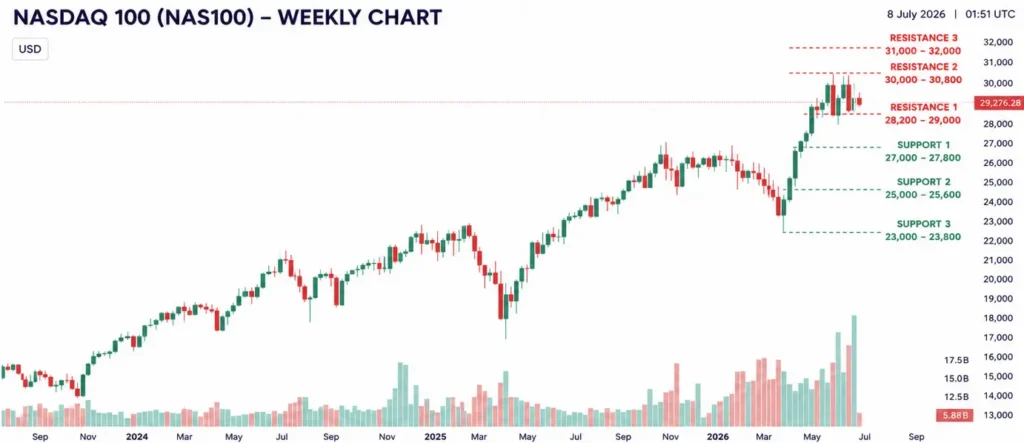
The NASDAQ 100 is trading around the 29,300 area on the weekly chart, with price consolidating just below the recent highs reached earlier this year.
The 27,000–27,800 region represents the nearest area of support, while resistance is identified between 28,200–29,000, followed by 30,000–30,800 and 31,000–32,000.
The weekly chart continues to reflect a period of consolidation after the recent advance, with price currently trading between established support and resistance levels. Market participants are likely to monitor these technical areas as longer-term price action continues to develop.
Bitcoin: Continuing to consolidate following a recent rebound from the US$61,500 area.
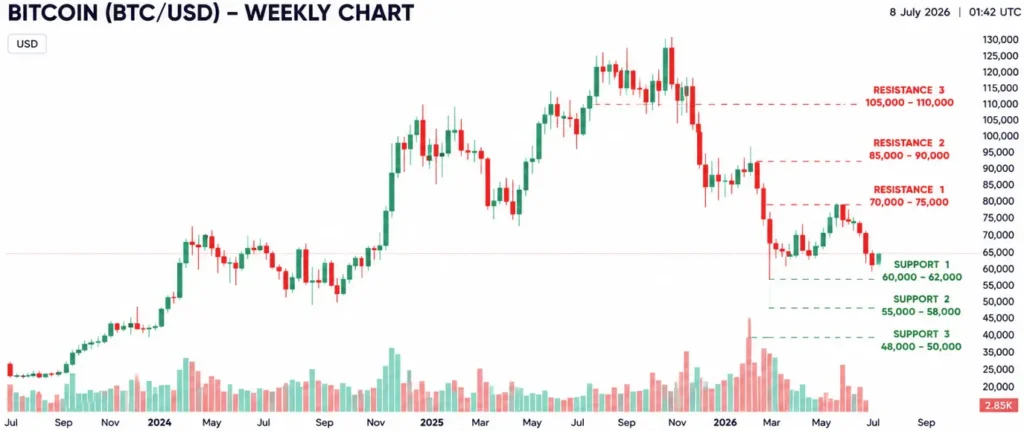
BTC/USD is trading around the US$63,000 area on the weekly chart, with price consolidating near the lower end of its recent trading range following the pullback from the all-time high recorded earlier this year.
The US$60,000–62,000 region represents the nearest area of support, while resistance is identified between US$70,000–75,000, followed by US$85,000–90,000 and US$105,000–110,000.
The weekly chart continues to reflect a period of consolidation after the recent decline, with price currently trading between established support and resistance levels. Market participants are likely to monitor these technical areas as the longer-term trend continues to develop.
Disclaimer: The material provided here has not been prepared in accordance with legal requirements designed to promote the independence of investment research and as such is considered to be a marketing communication. Whilst it is not subject to any prohibition on dealing ahead of the dissemination of investment research we will not seek to take any advantage before providing it to our client. No representation or warranty is given as to the accuracy or completeness of this information and therefore it shouldn’t be relied upon as such. Any research provided does not have regard to specific financial situations, needs or investment objectives. Vantage accepts no responsibility for any use that may be made of these comments and for any consequences that result. Consequently, any person acting on it does so entirely at their own risk. We advise any readers of this material to seek professional advice where necessary. Without the approval of Vantage, reproduction or redistribution of this information isn’t permitted.
-

Open Trading Account
Discover the endless trading possibilities with our cutting-edge platform, designed to empower our traders. Practice trading the markets with a free demo account today.
-

Download Vantage App
Trade on the go with the Vantage All-In-One Trading App, where smooth execution and market access come together in the palm of your hand.
-

Start Trading
Are you an existing user? Login to your account to start trading 1,000+ CFD products including forex, indices, gold, shares and more.
