
ASX Starts FY27 Softer as US Stocks Notch Best Quarter Since 2020

Hebe Chen >
Senior Market Analyst
Hebe Chen >
Senior Market Analyst

Australian shares opened the new financial year on a softer note, with weakness in consumer staples and financials offsetting gains in materials as commodity prices rebounded. The S&P/ASX 200 was lower in early trade, with seven of the 11 sectors in the red.
The ASX 200 delivered only a modest gain over the first half of the year, with sector performance remaining highly uneven. Consumer staples were among the stronger performers, while health care remained one of the key laggards.
Overnight, Wall Street closed higher, supported by renewed strength in technology shares and easing inflation concerns. The S&P 500 rose 0.8%, the Nasdaq 100 gained 1.7%, and the Dow Jones added 136 points to close at a record high of 52,319.
For the quarter, US equities delivered their strongest run in years. The S&P 500 rose nearly 15%, while the Nasdaq gained more than 21%, marking their best quarterly performances since Q2 2020. The Dow gained around 13%, its best quarter since 2022. Softer oil prices helped ease inflation concerns, reducing fears that the Federal Reserve may need to move more aggressively with rate hikes.
In commodities, gold hovered around US$4,000 per ounce after posting its worst quarter since 2013. The metal remains under pressure from restrictive Fed policy, higher Treasury yields and the unwinding of the dollar-debasement trade. Stronger US economic data has reinforced the hawkish case inside the Fed, while Warsh’s task forces to reassess Fed operations and balance-sheet policy have kept investors focused on the risk of tighter liquidity conditions.
This week, we take a look at three key charts: gold, Nasdaq 100 and Bitcoin.
Gold: Testing the US$4,000 Line of Confidence
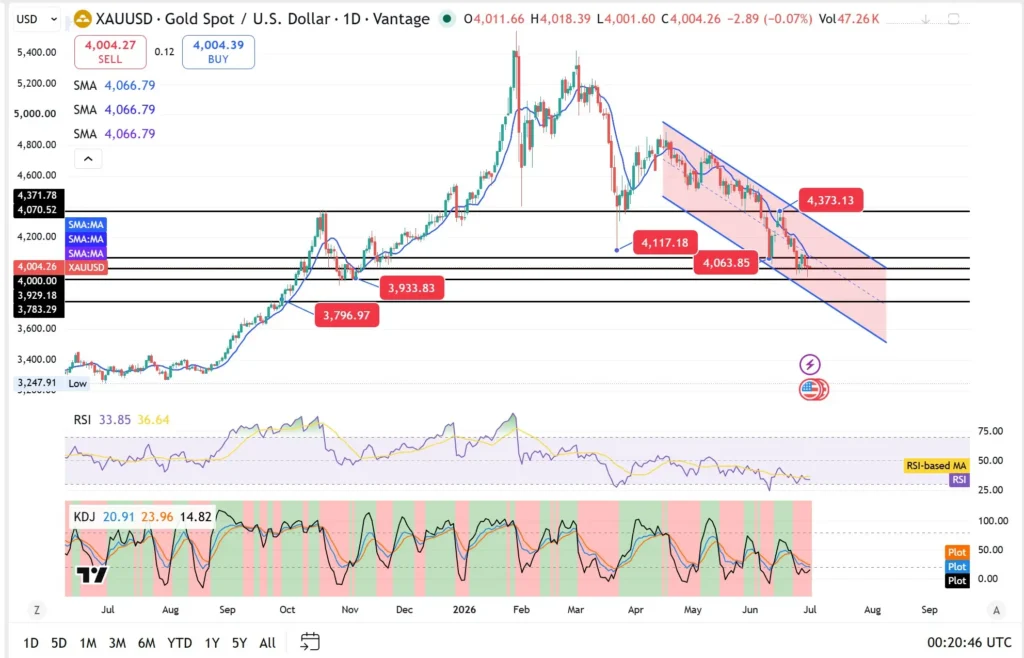
Technically, gold remains trapped in a descending channel and continues to test the US$4,000 psychological level. The US$4,064–US$4,070 area is the first resistance zone, followed by US$4,117 and US$4,373.
On the downside, a clear break below US$4,000 would put US$3,933 and US$3,797 back in focus. Momentum remains weak, with RSI hovering in the low 30s, suggesting sellers remain in control unless gold can reclaim the US$4,070 region.
Nasdaq 100: AI Momentum Still Holding the Line
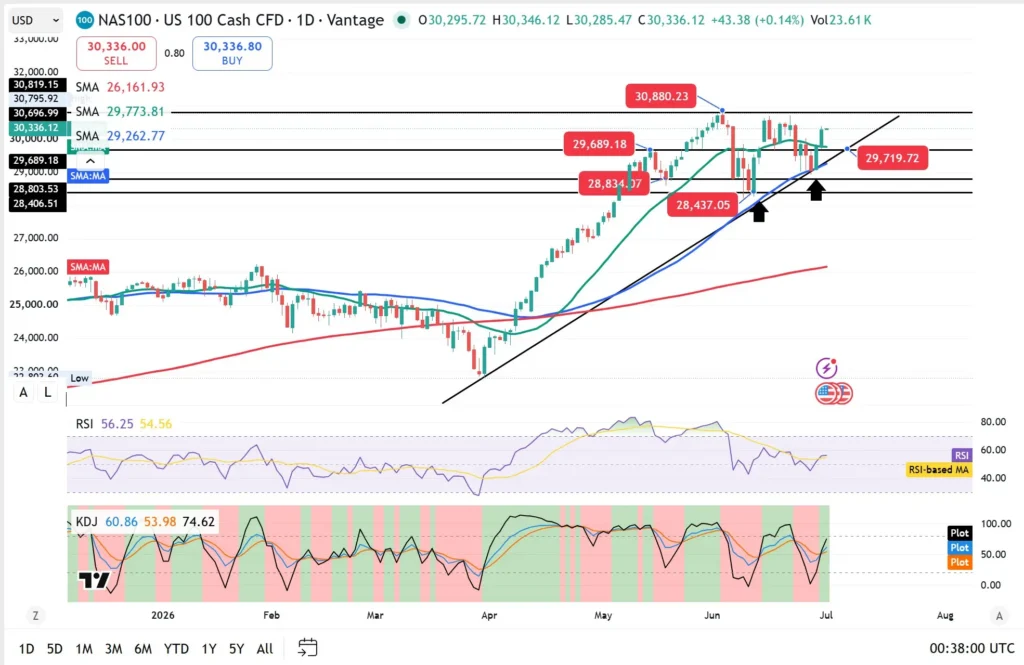
The Nasdaq 100 continues to trade with a constructive technical bias after rebounding from its rising trendline support. The index is holding above the 29,700 support area, while short-term moving averages continue to point higher.
A sustained move above 30,697–30,819 would reopen the path toward fresh highs. On the downside, support sits around 29,720, followed by 28,834 and 28,406. RSI has recovered toward the mid-50s, suggesting momentum has stabilised after the recent pullback.
The key message from the chart is that the AI trade has been tested, but not broken. As long as the Nasdaq holds above rising trendline support, buyers still appear willing to treat pullbacks as opportunities.
Bitcoin: Bearish Pressure Still Dominates
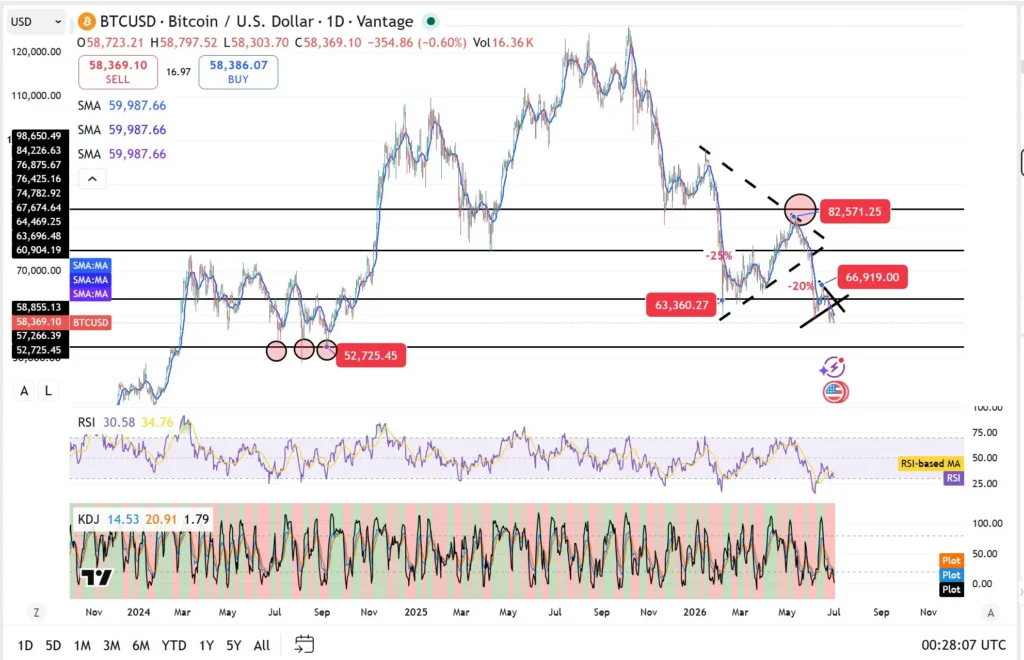
Bitcoin remains under technical pressure after failing to hold above the US$63,000–US$67,000 resistance zone. The price has slipped toward US$58,000, reinforcing the lower-high pattern from the earlier peak.
Near-term support sits around US$57,266, followed by the more important downside level near US$52,725, which has attracted buyers several times before. A clear break below that area would deepen the bearish structure.
On the upside, Bitcoin needs to reclaim US$63,360 first, then US$66,919, before the chart can begin to repair. RSI remains close to oversold territory, but so far there is limited evidence of a strong momentum reversal.
Disclaimer: The material provided here has not been prepared in accordance with legal requirements designed to promote the independence of investment research and as such is considered to be a marketing communication. Whilst it is not subject to any prohibition on dealing ahead of the dissemination of investment research we will not seek to take any advantage before providing it to our client. No representation or warranty is given as to the accuracy or completeness of this information and therefore it shouldn’t be relied upon as such. Any research provided does not have regard to specific financial situations, needs or investment objectives. Vantage accepts no responsibility for any use that may be made of these comments and for any consequences that result. Consequently, any person acting on it does so entirely at their own risk. We advise any readers of this material to seek professional advice where necessary. Without the approval of Vantage, reproduction or redistribution of this information isn’t permitted.
-

Open Trading Account
Discover the endless trading possibilities with our cutting-edge platform, designed to empower our traders. Practice trading the markets with a free demo account today.
-

Download Vantage App
Trade on the go with the Vantage All-In-One Trading App, where smooth execution and market access come together in the palm of your hand.
-

Start Trading
Are you an existing user? Login to your account to start trading 1,000+ CFD products including forex, indices, gold, shares and more.
