


[DAILY TRADING] NAS100 Analysis 28 July 2026 — Chip Stock Rout Drags the Nasdaq to Session Lows

Vantage Editorial Team >
Vantage Editorial Team >
Vantage is a global, multi-asset broker with a team of in-house writers and market analysts who produce educational and insightful trading content for traders of all levels.
 Updated Tue, 2026 July 28 04:03
![[DAILY TRADING] NAS100 Analysis 28 July 2026 — Chip Stock Rout Drags the Nasdaq to Session Lows](https://www.vantagemarkets.com/wp-content/uploads/2026/06/NAS100_hero_9Jun2026.webp)
Nasdaq today: the index is having a rough Tuesday. The Vantage NAS100 CFD sat at 27,866.35 as of 02:55 UTC (10:55, GMT+8) on 28 July 2026, dragged lower through the Asia session by a chip-stock selloff that started on Wall Street.
Monday set the mood for the Nasdaq stock market today. The Nasdaq Composite slipped 0.18% to close near 24,932, weighed down by a roughly 5% drop in Nvidia, even as the Dow added 0.51% to around 52,210 and the S&P 500 barely moved.[1] That risk-off tone spread into Tuesday’s Asian semiconductor trade, with South Korea’s Samsung Electronics and SK Hynix both falling sharply.[2]
This piece reads today’s NAS100 chart and the news behind it, without calling where the index goes next. All prices are as of 02:55 UTC (10:55, GMT+8) on 28 July 2026. Charts are indicative and from TradingView. This is not financial advice.
Key Points
- NAS100 sits near session lows as of 10:55 (GMT+8) on 28 July 2026, trading below both its 50-period and 200-period moving averages.
- A roughly 5% drop in Nvidia led Monday’s chip-stock selloff, which spread into Tuesday’s Asia session as Samsung Electronics and SK Hynix both fell sharply.
- The Federal Reserve’s July meeting wraps up Wednesday, with a run of Big Tech earnings close behind, so the Nasdaq index today is bracing for a busier week than usual.
Reading the Nasdaq 100 Chart Today
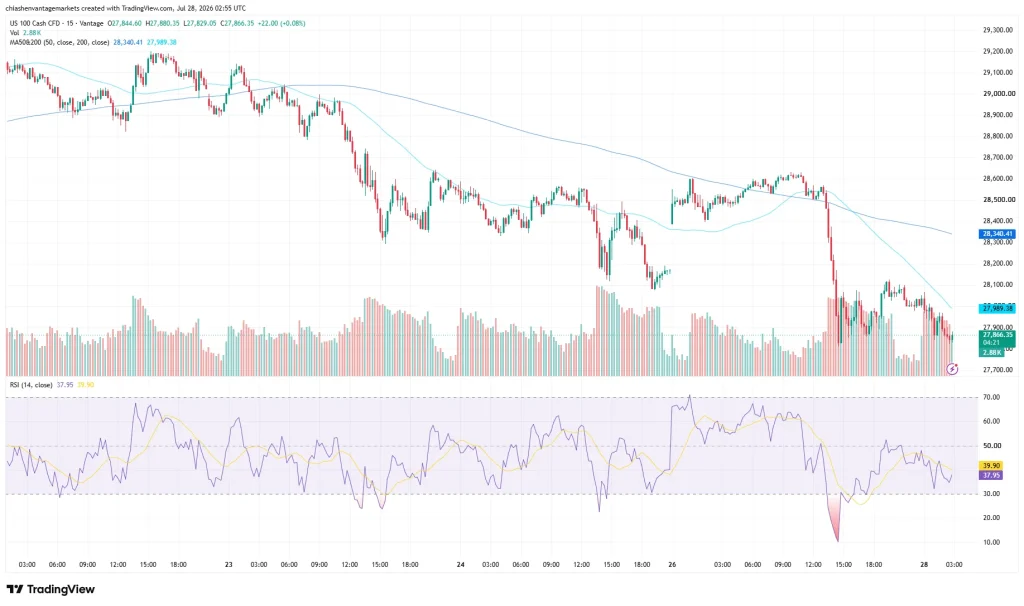
On the 15-minute Nasdaq index chart used for this analysis, the Vantage NAS100 CFD opened at 27,844.60, tagged a high of 27,880.35 and a low of 27,829.05, and last traded at 27,866.35, up 22.00 points, or 0.08%, on volume of 2.88K, extending the drift lower flagged in last week’s Nasdaq 100 update.
Zoom out, and the Nasdaq chart tells a less flattering story. Price sits below both moving averages plotted here, the 50-period average near 28,340.41 and the 200-period average near 27,989.38, a setup consistent with bearish short-term price structure on this 15-minute timeframe.
The RSI on the TradingView setup used for this analysis reads 37.95, with its signal average at 39.90, still short of the 30 level usually read as oversold. It fell much further earlier in the week during a volatile session, recovered into the 60s, then rolled over again as the Nasdaq 100 index moved back toward the lower end of its recent range into Tuesday.
The session low of 27,829.05 is the nearest potential support on the radar. The 28,050 to 28,340 zone above is the nearest potential resistance area.
Chip Stocks Are Doing the Heavy Lifting

Nvidia’s roughly 5% slide on Monday coincided with reports that the company was discussing a potential financing guarantee of as much as $250 billion related to OpenAI’s use of computing capacity from a planned data-centre project, reviving questions over how much of the AI buildout Nvidia itself is underwriting, on top of fresh worry over cheaper Chinese AI models.[2]
Samsung Electronics and SK Hynix both fell sharply in Tuesday’s Asia session, while South Korea’s KOSPI also traded sharply lower.[2] The Asian selloff reinforced concerns around the global semiconductor trade, relevant to NAS100 given its heavy exposure to large technology and chip stocks.
Oil Slips, and the Fed Takes Centre Stage
Away from chips, oil fell sharply Monday after the US and Iran paused their exchange of strikes, easing some of the Middle East conflict risk premium in markets.[4] WTI crude fell about 7.5% to settle around $82.61 a barrel, easing some inflation and energy-cost concerns while technology stocks remained under pressure.
Wednesday is the bigger date on the calendar. The Federal Reserve, under Chair Kevin Warsh, wraps up a two-day policy meeting on 29 July, with the statement due at 14:00 (US Eastern Time) and no fresh dot plot this time.[5] The federal funds rate has held at 3.50% to 3.75% since June, and the decision lands the same week as earnings from Microsoft, Meta, Apple, and Amazon.[3,6] With NAS100 so heavily weighted to mega-cap tech, their capital-spending comments may move the index just as much as the rate call itself.
NAS100 Levels to Watch, and the Risk Side of Things
The table below covers the zones traders are watching on the Nasdaq index CFD. These are reference levels, not trade signals.
| Pair | Potential Support | Potential Resistance | What’s happening |
| NAS100 | 27,829 | 28,050 / 28,340 | Trading below both the 50 and 200-period moving averages, tracking chip-sector weakness |
Table 1: Key NAS100 levels as of 02:55 UTC (10:55, GMT+8), 28 July 2026. Source: Vantage NAS100 CFD, TradingView. Indicative only.
What to watch: the Fed statement Wednesday at 14:00 (US Eastern Time), this week’s Big Tech earnings run, and whether chip stocks find a floor in Asian and European trading.
Recent price ranges highlight the importance of accounting for volatility when assessing risk, while simultaneous exposure to NAS100 and other chip-sensitive positions can increase concentration in the same underlying technology-sector risk.
Leverage magnifies both gains and losses, making risk exposure particularly important around Wednesday’s Fed statement and this week’s technology earnings.
RISK WARNING: CFDs are complex financial instruments and carry a high risk of losing money rapidly due to leverage. You should ensure you fully understand the risks involved and carefully consider whether you can afford to take the high risk of losing your money before trading.
Disclaimer: The information is provided for educational purposes only and doesn’t take into account your personal objectives, financial circumstances, or needs. It does not constitute investment advice. We encourage you to seek independent advice if necessary. The information has not been prepared in accordance with legal requirements designed to promote the independence of investment research. No representation or warranty is given as to the accuracy or completeness of any information contained within. This material may contain historical or past performance figures and should not be relied on. Furthermore, estimates, forward-looking statements, and forecasts cannot be guaranteed. The information on this site and the products and services offered are not intended for distribution to any person in any country or jurisdiction where such distribution or use would be contrary to local law or regulation.
References
[1] “Stock Market Today, July 27: Dow Rises on Oil Retreat, and Sandisk Plunges 11% on Memory Weakness – The Motley Fool” https://www.fool.com/coverage/stock-market-today/2026/07/27/stock-market-today-july-27-dow-rises-on-oil-retreat-and-sandisk-plunges-11-on-memory-weakness/ Accessed on 28 July 2026.
[2] “Samsung, SK Hynix slide amid Nvidia financing worries, China competition – Reuters via Yahoo Finance” https://finance.yahoo.com/markets/stocks/articles/samsung-sk-hynix-slide-amid-005745736.html Accessed on 28 July 2026.
[3] “Stock Market Midday, July 27: Dow Edges Higher as Nvidia Drop Weighs on Nasdaq – The Motley Fool” https://www.fool.com/coverage/stock-market-today/2026/07/27/stock-market-midday-july-27-dow-edges-higher-as-nvidia-drop-weighs-on-nasdaq/ Accessed on 28 July 2026.
[4] “How major US stock indexes fared Monday 7/27/2026 – The Washington Post” https://www.washingtonpost.com/business/2026/07/27/wall-street-stocks-dow-nasdaq/504db546-89f8-11f1-8912-d71e69d679d7_story.html Accessed on 28 July 2026.
[5] “July 2026 – Federal Reserve Events Calendar” https://www.federalreserve.gov/newsevents/2026-july.htm Accessed on 28 July 2026.
[6] “Minutes of the Federal Open Market Committee, June 16-17, 2026 – Federal Reserve” https://www.federalreserve.gov/monetarypolicy/fomcminutes20260617.htm Accessed on 28 July 2026.
