


[DAILY TRADING] Meta (META) Stock Analysis 27 July 2026 — Oversold Signals Flash Before Earnings

Vantage Editorial Team >
Vantage Editorial Team >
Vantage is a global, multi-asset broker with a team of in-house writers and market analysts who produce educational and insightful trading content for traders of all levels.
 Updated Mon, 2026 July 27 09:08
![[DAILY TRADING] Meta (META) Stock Analysis 27 July 2026 — Oversold Signals Flash Before Earnings](https://www.vantagemarkets.com/wp-content/uploads/2026/07/meta.webp)
Meta stock news today starts with a simple fact: the rally is gone. The Vantage META CFD traded near $595 as of 08:13 UTC (16:13 GMT+8) on 27 July 2026, sitting below both its 50-period and 200-period moving averages just two sessions before Meta’s second-quarter earnings.
This is a Meta stock analysis, not a Meta stock forecast or a price prediction. Shares have unwound a sharp mid-July run, the 14-period RSI on the TradingView setup used for this analysis has dropped into oversold territory, and the chart is now asking a fairly blunt question: does oversold mean done falling, or just tired?
Key Points
- The Vantage META CFD traded near $595.19 as of 16:13 (GMT+8) on 27 July 2026, sitting beneath its 50-period moving average ($638.60) and 200-period moving average ($603.62) on the TradingView setup used for this analysis.
- The 14-period RSI has fallen to 28.03, its third dip below the conventional 30 oversold threshold this month, indicating stretched downside momentum rather than providing a reversal signal.
- Meta reports Q2 2026 earnings after the US market close on Wednesday, 29 July, with Wall Street’s early-to-mid-July consensus centred near $7.17 to $7.18 in EPS, numbers that tend to shift closer to the print. [4]
What the Chart Is Showing
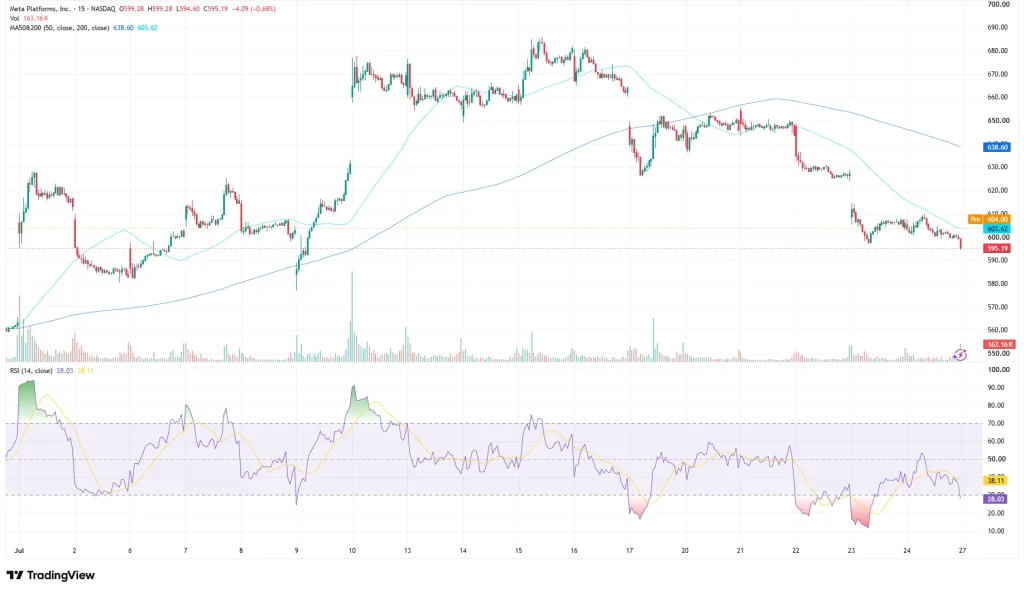
On the 15-minute candle used for this reading, the Vantage META CFD opened at $599.28, hit a high of $599.28, dipped to $594.60, and settled at $595.19, a candle-level move of -4.09 (-0.68%) on volume of 163.16K. A pre-market indicator on the chart shows 604.00, just above the last traded level.
The bigger story sits above that single candle. Meta stock rallied from around $560 in early July to an intraday high near $684 by mid-month, before reversing sharply. Price is trading below both the 50-period moving average ($638.60) and 200-period moving average ($603.62) on the TradingView setup used for this analysis. The 603 to 605 zone, where the 200-period moving average now sits, is the level the market is watching if any bounce shows up.
The 14-period RSI reads 28.03, while its RSI-based moving average stands at 38.11, its third dip below the conventional 30 oversold threshold this month. That indicates stretched downside momentum rather than providing a reversal signal, and is best read alongside price action rather than on its own.
Two Things Shaping Meta Stock Ahead of Earnings

The AI Spending Debate
Moody’s Ratings said this week that AI infrastructure spending is straining the balance sheets of the hyperscalers it tracks, a list that includes Meta, Amazon, Alphabet, Microsoft, Oracle and CoreWeave. [1] The agency puts combined capex across those six near $785 billion in 2026, climbing toward $1 trillion in 2027, increasingly funded by debt rather than cash. [1]
Meta still ranks among the group’s strongest balance sheets, per Moody’s, with the sharpest ratings pressure sitting elsewhere. [1] Meta, one of the so-called Magnificent Seven stocks, also joined Nvidia and Microsoft this week in pushing back on proposals to tighten regulation of open-weight AI models. [6] None of that is Meta-specific news, but it is the backdrop the market is reading Meta stock against heading into earnings.
The Countdown to Wednesday’s Print
Meta reports second-quarter 2026 results after the US market close on Wednesday, 29 July, followed by a conference call. [2] Its first-quarter 2026 results, out in April, showed revenue of $56.31 billion and diluted EPS of $7.31, with second-quarter revenue guidance of $58 billion to $61 billion. [3]
Wall Street’s consensus for the quarter has centred on EPS near $7.17 to $7.18 and revenue near $60 billion, per estimates reported in mid-to-late July. [4,5] Consensus numbers move in the days before a print, so treat those as a starting point rather than the final word, and check a live tracker closer to Wednesday — that is just how earnings season works.
Levels to Watch
The zones below are what the market is watching on the Vantage META CFD: reference levels, not trade signals.
| Instrument | Immediate Support | Resistance | What’s happening |
| META | 594.60 | 603.62 / 638.60 | Price sits beneath both moving averages; 594.60 is the latest session low used as a near-term reference, while the 200-period moving average near $603.62 is the first level the market is watching on any recovery attempt |
Table 1: Key levels as of 16:13 (GMT+8), 27 July 2026. Source: the TradingView setup used for this analysis, the Vantage CFD feed. Indicative only.
What to Watch This Week and Beyond
- Q2 2026 Earnings, 29 July: Meta reports after the US market close, with a conference call the same day. [2]
- Capex Guidance Update: Any change to full-year expense or capital expenditure guidance is likely to be read alongside the Moody’s commentary on hyperscaler debt. [1]
- Moving Average Retest: The market is watching whether price moves back above the 200-period moving average near $603.62, or whether the 50-period moving average near $638.60 continues to act as overhead resistance.
Volatility tends to widen fast around a scheduled earnings release, and a setup already sitting below both key moving averages has produced sizeable single-session swings this month. Those levels can also serve as technical reference points when assessing risk around the earnings release, alongside overall account exposure to a single earnings event, including how Stop Loss levels line up ahead of trading through earnings announcements.
CFDs, including the Vantage META CFD, are leveraged products. Leverage magnifies both gains and losses relative to the capital committed, in either direction. Position sizing relative to account equity is worth a second look ahead of a scheduled earnings release, when price gaps become more likely. Traders looking to access Meta and other share CFDs can do so through a Vantage account.
RISK WARNING: CFDs are complex financial instruments and carry a high risk of losing money rapidly due to leverage. You should ensure you fully understand the risks involved and carefully consider whether you can afford to take the high risk of losing your money before trading.
Disclaimer: The information is provided for educational purposes only and doesn’t take into account your personal objectives, financial circumstances, or needs. It does not constitute investment advice. We encourage you to seek independent advice if necessary. The information has not been prepared in accordance with legal requirements designed to promote the independence of investment research. No representation or warranty is given as to the accuracy or completeness of any information contained within. This material may contain historical or past performance figures and should not be relied on. Furthermore estimates, forward-looking statements, and forecasts cannot be guaranteed. The information on this site and the products and services offered are not intended for distribution to any person in any country or jurisdiction where such distribution or use would be contrary to local law or regulation.
References
[1] “Moody’s says ‘unprecedented’ AI spending threatens credit quality of Amazon, Meta, Alphabet and others – CNBC” https://www.cnbc.com/2026/07/24/moodys-ai-spending-credit-quality-amazon-meta-alphabet.html Accessed on 27 July 2026.
[2] “Meta Platforms (META) Stock News & Updates – StockTitan” https://www.stocktitan.net/news/META/ Accessed on 27 July 2026.
[3] “Meta Reports First Quarter 2026 Results – StockTitan” https://www.stocktitan.net/news/META/meta-reports-first-quarter-2026-q8s4s20oh4ah.html Accessed on 27 July 2026.
[4] “Why Is Meta Platforms Stock Gaining Tuesday? – Benzinga” https://www.benzinga.com/analyst-stock-ratings/analyst-color/26/07/60315404/why-is-meta-platforms-stock-gaining-tuesday Accessed on 27 July 2026.
[5] “Meta Platforms, Inc. (META) Stock Price, News, Quote & History – Yahoo Finance” https://finance.yahoo.com/quote/META/ Accessed on 27 July 2026.
[6] “META: Meta Platforms Inc – Stock Price, Quote and News – CNBC” https://www.cnbc.com/quotes/META Accessed on 27 July 2026.
