


US Dollar Index (DXY) Forecast: USDX Chart Near 100.90

Vantage Editorial Team >
Vantage Editorial Team >
Vantage is a global, multi-asset broker with a team of in-house writers and market analysts who produce educational and insightful trading content for traders of all levels.
 Updated Mon, 2026 July 13 02:53
The US Dollar Index chart (USDX) closed its most recent four-hour candle at 100.921, up 0.13% on the session, as of 09:44 (GMT+8) on 13 July 2026.1 This DXY forecast update comes at a busy moment: Fed Chair Kevin Warsh has just named the leadership of five task forces set to review how the central bank operates,2 rate hike bets for the Federal Reserve’s September meeting have firmed over the past week,3 and the ceasefire between the United States and Iran has collapsed and flared again within days.4 The dollar, for now, is caught between safe-haven demand and a softening jobs picture.
Key Points
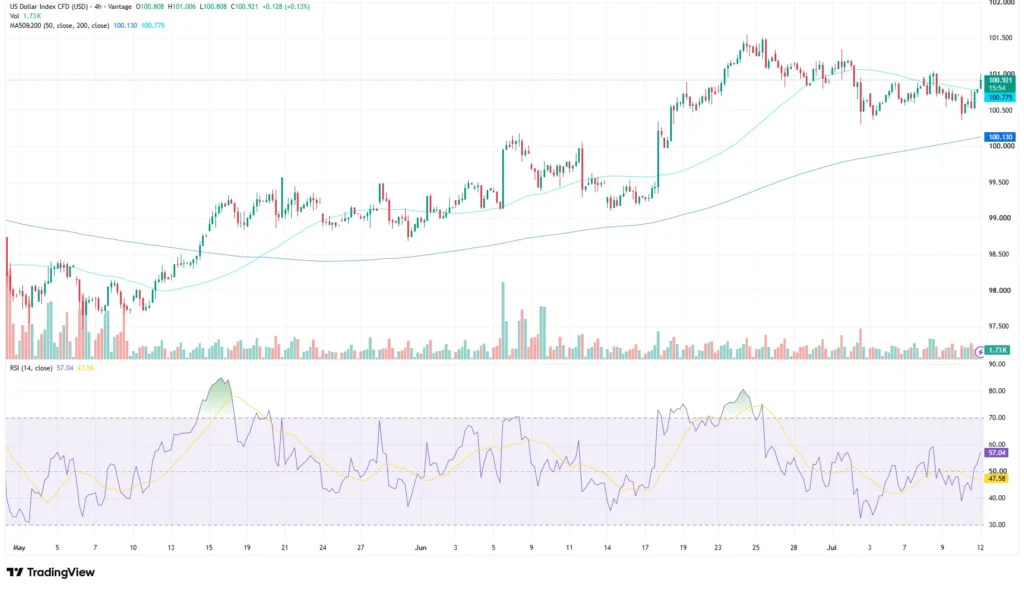
- The US Dollar Index CFD traded at 100.921 as of the last close on the USDX chart, holding inside a range framed by the 50-period moving average near 100.13 and the 200-period moving average near 100.78, with the Relative Strength Index at 57.04.1
- June’s non-farm payrolls report added only 57,000 jobs, well short of forecasts near 110,000, while the unemployment rate eased to 4.2% on a shrinking labour force.5
- The Middle East conflict flared again in early July after Iran targeted commercial vessels in the Strait of Hormuz, prompting fresh US strikes and a short-lived dollar safe-haven bid.4,6
What the chart is showing
This USDX chart analysis is based on Vantage’s US Dollar Index CFD four-hour setup, with the most recent completed candle closing at 100.921 as of 09:44 (GMT+8) on 13 July 2026.1 The session ranged between 100.808 and 101.006, a fairly tight band, with 1.73 thousand lots traded on the Vantage CFD feed.
The broader structure remains a sequence of higher highs and higher lows from early May through late June, before transitioning into sideways consolidation. The index climbed from the high-98 area in early May to a fresh cycle high above 101 by late June 2026, within a wider 52-week range of 95.55 to 101.80, with the high recorded around 24 June 2026.7 That advance has since given way to consolidation, with the index holding a range of approximately 100.45 to 101.05 over the past two weeks.
The 50-period moving average sits at 100.13, while the 200-period moving average has drifted up to 100.78, the TradingView setup used for this analysis shows.1 The distance between the two has narrowed compared with late June, reflecting slowing upside momentum rather than a decisive trend reversal.
The Relative Strength Index reads 57.04, with its moving average overlay at 47.58, the same TradingView setup shows.1 That places momentum just above the midline, below the overbought readings near 70 to 80 seen twice on this chart in June, and consistent with an index easing from previously overbought conditions rather than one that is oversold and due a bounce.
The macro backdrop: Fed policy, jobs, and the Middle East risk premium

Three forces are shaping the dollar this week. The first is the Federal Reserve: the Federal Open Market Committee held its benchmark rate at 3.50% to 3.75% at the 16 to 17 June 2026 meeting, the first chaired by Kevin Warsh.8 The dot plot showed nine of the committee’s 18 officials pencilling in at least one rate hike for 2026, a shift from the earlier cutting bias; Warsh himself did not submit a projection.8 Minutes released on 8 July 2026 showed policymakers still divided, with only a handful favouring a hike outright.3
Markets are pricing a possible move by September, though odds have swung with each data point: Trading Economics data put the probability of a September hike at around 62% as of 10 July 2026, up from 58% a week earlier but down from roughly 70% earlier in the same week.3 The next scheduled FOMC decision falls on 29 July 2026.9
The second is the labour market. June’s non-farm payrolls report, published 2 July 2026, added 57,000 jobs against a consensus near 110,000 to 115,000, the softest print in four months.5 The unemployment rate eased to 4.2%, its lowest in a year, partly reflecting a drop in labour force participation to 61.5%, the lowest since March 2021.5 April and May payrolls were revised down by a combined 74,000.5 The soft print initially pulled September hike odds lower before the Middle East news pulled sentiment back the other way.
The third is the Middle East conflict. The ceasefire agreed under the mid-June Islamabad Memorandum came under pressure in early July after Iran targeted commercial vessels transiting the Strait of Hormuz.4 The US responded with fresh strikes on 8 and 9 July 2026, and President Trump said the ceasefire was “over”, while mediators from Qatar and Pakistan worked to bring both sides back to talks.4 The dollar picked up safe-haven demand on 8 July 2026 before easing back as peace-talk headlines resurfaced.6 Traffic through the strait has stayed well below its pre-escalation pace.4
Where USDX sits against EURUSD, USDJPY and GBPUSD
The US Dollar Index, whether viewed on MarketWatch or Vantage’s USDX chart, does not move in isolation. It is a weighted basket, with the euro carrying the largest share at 57.6%, followed by the yen at 13.6%, the pound at 11.9%, the Canadian dollar at 9.1%, the Swedish krona at 4.2% and the Swiss franc at 3.6%.3
EURUSD has stayed range-bound through the first half of July, with policy differentials between the Fed and other major central banks cited as a key driver. A stronger-than-expected US inflation print later this week would likely reinforce expectations that US rates remain higher than those of several major central banks, supporting the dollar; a soft one would work the other way.
USDJPY has held close to its highest levels since 1986, trading above the 160 handle for much of the past month.10 Investing.com’s technical coverage this week attributed the pair’s resilience to the gap between Fed and Bank of Japan policy rather than any single data print.10 Japanese authorities have intervened near similar levels before, and traders are watching that possibility again.
GBPUSD has traded in a similar range-bound pattern to the euro this month, tracking overall dollar positioning rather than a distinct UK catalyst.
Levels to watch
The table below sets out the ranges traders are watching across the US Dollar Index and its most-quoted pairs. These are reference points drawn from recent price action, not trade signals.
| Pair | Support | Resistance | What’s happening |
| USDX | 100.13 (50-period MA) | 100.78 / 101.00 | Consolidating after the June rally; RSI at 57.04 |
| EURUSD | 1.1360 | 1.1480 / 1.1915 | Range-bound on the Fed policy gap versus other major central banks |
| USDJPY | 159.90 / 158.00 | 162.40 / 162.70 | Near 40-year highs; intervention risk in focus |
| GBPUSD | 1.3240 | 1.3410 | Tracking broader dollar positioning |
Table 1: Key levels as of 13 July 2026. Sources: TradingView, Investing.com, Vantage USD Index CFD chart. Indicative only.

What to watch this week and beyond
- June CPI, 14 July 2026: The most immediate print. A hotter-than-expected reading would likely firm September rate hike pricing further and support the dollar; a soft one would work the other way.
- FOMC meeting, 28 to 29 July 2026: The Federal Reserve’s next scheduled decision. This meeting does not include a fresh Summary of Economic Projections.
- Strait of Hormuz developments: Any credible sign that transit volumes are normalising would ease the near-term risk premium; renewed strikes would work the other way.
- Fed task force output: The five task forces named on 9 July, covering communications, the balance sheet, data, productivity and jobs (including artificial intelligence), and inflation frameworks, are not expected to report immediately, but any early signal on their direction could move rate expectations.
With the index compressing between its 50-period and 200-period moving averages and a fresh round of inflation data due this week, the potential for a sharper break in either direction has increased. Traders holding positions across the dollar, gold, or yen crosses often review their combined exposure in weeks like this, since a shift in Fed pricing or a Middle East escalation could move several markets in the same direction at once.
Many traders may monitor the 100.13 support region and the 100.78 to 101.00 resistance area when assessing risk, although appropriate Stop Loss placement depends on individual trading strategies and risk tolerance.
Leverage remains a double-edged tool in this kind of environment. It can just as easily magnify a loss as a gain, and this week’s calendar (CPI, an FOMC meeting a little over two weeks out, and an unresolved Middle East situation) is dense enough that position sizing relative to account equity is worth revisiting before the next data point lands.

RISK WARNING: CFDs are complex financial instruments and carry a high risk of losing money rapidly due to leverage. You should ensure you fully understand the risks involved and carefully consider whether you can afford to take the high risk of losing your money before trading.
Disclaimer: The information is provided for educational purposes only and doesn’t take into account your personal objectives, financial circumstances, or needs. It does not constitute investment advice. We encourage you to seek independent advice if necessary. The information has not been prepared in accordance with legal requirements designed to promote the independence of investment research. No representation or warranty is given as to the accuracy or completeness of any information contained within. This material may contain historical or past performance figures and should not be relied on. Furthermore estimates, forward-looking statements, and forecasts cannot be guaranteed. The information on this site and the products and services offered are not intended for distribution to any person in any country or jurisdiction where such distribution or use would be contrary to local law or regulation.
References
[1] Vantage USD Index CFD (USDX) 4-hour chart, TradingView. Accessed on 13 July 2026.
[2] “Federal Reserve announces the leadership and objectives of its task forces to advance the conduct of monetary policy – Federal Reserve” https://www.federalreserve.gov/newsevents/pressreleases/monetary20260709a.htm Accessed on 13 July 2026.
[3] “United States Dollar – Quote – Chart – Historical Data – News – Trading Economics” https://tradingeconomics.com/united-states/currency Accessed on 13 July 2026.
[4] “July 10, 2026: Mediators work to de-escalate US-Iran tensions and revive talks – CNN” https://www.cnn.com/2026/07/10/world/live-news/iran-war-trump Accessed on 13 July 2026.
[5] “Employment Situation Summary – 2026 M06 Results – U.S. Bureau of Labor Statistics” https://www.bls.gov/news.release/archives/empsit_07022026.htm Accessed on 13 July 2026.
[6] “Dollar Gets Safe-Haven Flows as US-Iran Ceasefire Under Threat – Bloomberg” https://www.bloomberg.com/news/articles/2026-07-08/dollar-gets-safe-haven-flows-as-us-iran-ceasefire-under-threat Accessed on 13 July 2026.
[7] “Check out ICE U.S. Dollar Index’s stock price (.DXY) in real time – CNBC” https://www.cnbc.com/quotes/.DXY Accessed on 13 July 2026.
[8] “Fed Meeting Tracker 2026: How Interest Rate Shifts Shape Investor Strategy in July – Forbes” https://www.forbes.com/sites/investor-hub/article/fed-meeting-tracker-interest-rate-strategy/ Accessed on 13 July 2026.
[9] “Federal Reserve Board – Calendar: July 2026” https://www.federalreserve.gov/newsevents/2026-july.htm Accessed on 13 July 2026.
[10] “USD/JPY at 162 Shows the Market Is Still Calling Tokyo’s Bluff – Investing.com” https://www.investing.com/analysis/usdjpy-at-162-shows-the-market-is-still-calling-tokyos-bluff-200683413 Accessed on 13 July 2026.
[11] “U.S. Employment (June 2026) – TD Economics” https://economics.td.com/us-employment Accessed on 13 July 2026.
