


[DAILY TRADING] DJ30 Analysis 13 July 2026 — Dow Jones Today: Now Near 52,503 as Iran Risk Returns

Vantage Editorial Team >
Vantage Editorial Team >
Vantage is a global, multi-asset broker with a team of in-house writers and market analysts who produce educational and insightful trading content for traders of all levels.
 Updated Mon, 2026 July 13 05:52
![[DAILY TRADING] DJ30 Analysis 13 July 2026 — Dow Jones Today: Now Near 52,503 as Iran Risk Returns](https://www.vantagemarkets.com/wp-content/uploads/2026/06/DJ30_hero_18Jun2026.webp)
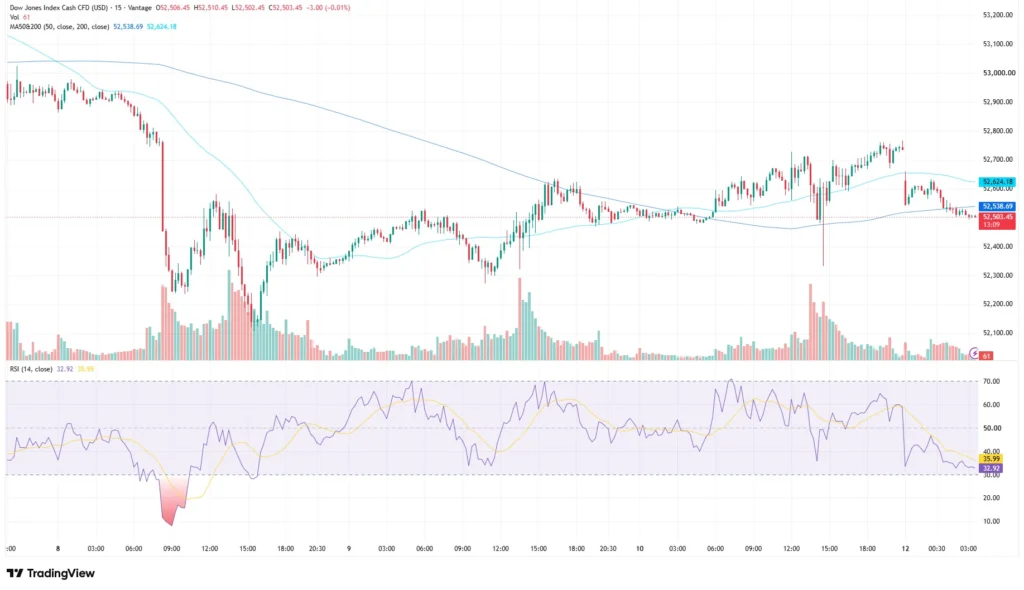
As of 11:31 (GMT+8) / 03:31 UTC on 13 July 2026, the Vantage DJ30 CFD traded at 52,503.45, down 3.00 points, or 0.01%. That’s the Dow Jones right now: a small move on its own, but the tail end of a bigger swing. The index pulled back from a weekend high close to 52,750 after a fresh US strike on Iran and a disputed Iranian threat to shipping through the Strait of Hormuz reached trading desks on Sunday.
This analysis combines the Dow Jones technical picture with the key macroeconomic and geopolitical developments influencing sentiment. It does not call a direction for the index.
Key Points
- The Dow Jones today trades near 52,503 as of 11:31 (GMT+8) on 13 July, pulling back from a weekend high close to 52,750.
- The Dow Jones now sits below both moving averages on the chart used for this analysis, with the RSI near 33, in weaker territory but well above the extreme lows seen earlier in the week.
- Oil rose roughly 4% as renewed US-Iran tensions and concerns over Strait of Hormuz shipping lifted the geopolitical risk premium ahead of Tuesday’s US inflation print.
What the DJ30 chart is showing
The Dow Jones chart on the 15-minute timeframe shows the Vantage DJ30 CFD consolidating just under both of its moving averages. The 50-period moving average sits at 52,538.69 and the 200-period moving average sits at 52,624.18 on the TradingView setup used for this analysis, with price trading below both. The RSI on the same setup reads 32.92, with its moving average overlay at 35.99, a soft momentum zone well off the extreme oversold readings seen earlier in the week.
The broader path helps explain where the Dow Jones index stands today. It dropped sharply mid-last week, then spent Wednesday through Friday staging a gradual recovery in small steps. That climb carried through the weekend into a high close to 52,750, before easing back through Monday’s early hours to the low 52,500s, where DJ30 has traded since. The Dow Jones index chart below captures that move. See all Dow Jones 30 news here.
The Dow Jones news behind the move

The week’s price action has tracked the Middle East closely. The Dow closed above 53,000 for the first time on 6 July 2026, then eased 0.25% to 52,925.15 on 7 July 2026. [1] Sentiment turned on 8 July, when the US President said the ceasefire covering the Middle East conflict was “over” following fresh strikes; the index fell 576.76 points, or 1.09%, to 52,348.39 as oil jumped. [2]
The Dow Jones recovered into the back half of last week, adding 139.02 points to 52,487.41 on 9 July as chip stocks rallied, then 149.61 points to 52,637.01 on 10 July 2026, helped by a large US listing in the semiconductor sector. [3]
Over the weekend, US Central Command carried out a third round of strikes on Iran this week, in response to an Iranian attack on a Cyprus-flagged container ship transiting the Strait of Hormuz. [4] Iran’s Revolutionary Guard Navy said the strait was closed “until further notice,” a declaration US Central Command explicitly rejected, stating that Iran does not control the waterway and that traffic continued to flow. [4] Crude oil rose roughly 4% to above $74 a barrel on Monday as the renewed US-Iran tensions and the Strait of Hormuz shipping concerns lifted the geopolitical risk premium, and that pressure has coincided with the pullback from the weekend high. [5]
The next scheduled catalyst is the US Consumer Price Index report for June, due Tuesday 14 July at 08:30 ET. It is one of the last inflation prints the Federal Reserve will see before its 28 to 29 July meeting. [6]
Dow Jones index today: levels traders are watching
| Level | Price Area | Type | What’s Happening |
| Week’s low | ~52,270 | Support | Session low after Wednesday’s drop |
| 50-period MA | 52,538.69 | Dynamic resistance | Price trading below this moving average |
| 200-period MA | 52,624.18 | Dynamic resistance | Price trading below this moving average |
| Week’s high | ~52,750 | Resistance | Weekend session high before Monday’s pullback |
Table 1: Reference levels for the Vantage DJ30 CFD as of 13 July 2026. Source: TradingView and Investing.com. Indicative only.
The low 52,300s marked the floor after Wednesday’s drop, while the mid-52,700s capped the weekend recovery. [7] The two moving averages, at 52,538.69 and 52,624.18, now act as nearby dynamic resistance after price slipped back beneath them.

What to watch next
The June CPI print on 14 July 2026 arrives before the regular equity session opens, so the first reaction typically shows up in futures and premarket trading. [6] Beyond that, for the latest Dow Jones news today, keep watching Strait of Hormuz headlines and any further exchange between Washington and Tehran.
Given how closely the index has tracked headline risk, standard intraday range assumptions carry less weight than usual. Market participants often monitor the zone around the session’s recent lows and highs when thinking through Stop Loss placement, since a level that held earlier in the week does not guarantee it holds again if the news flow shifts quickly.
Leverage remains a double-edged tool in this kind of headline-driven environment: it can magnify gains just as easily as losses, and moves in either direction can happen quickly around scheduled data such as Tuesday’s CPI print. Position sizing relative to account equity is worth revisiting ahead of that release, particularly for exposure linked to the Vantage DJ30 CFD.

RISK WARNING: CFDs are complex financial instruments and carry a high risk of losing money rapidly due to leverage. You should ensure you fully understand the risks involved and carefully consider whether you can afford to take the high risk of losing your money before trading.
Disclaimer: The information is provided for educational purposes only and doesn’t take into account your personal objectives, financial circumstances, or needs. It does not constitute investment advice. We encourage you to seek independent advice if necessary. The information has not been prepared in accordance with legal requirements designed to promote the independence of investment research. No representation or warranty is given as to the accuracy or completeness of any information contained within. This material may contain historical or past performance figures and should not be relied on. Furthermore estimates, forward-looking statements, and forecasts cannot be guaranteed. The information on this site and the products and services offered are not intended for distribution to any person in any country or jurisdiction where such distribution or use would be contrary to local law or regulation.
References
[1] “Stock market news for July 7, 2026 – CNBC” https://www.cnbc.com/2026/07/06/stock-market-today-live-updates.html Accessed on 13 July 2026.
[2] “Stock market news for July 8, 2026 – CNBC” https://www.cnbc.com/2026/07/07/stock-market-today-live-updates.html Accessed on 13 July 2026.
[3] “Stock market today: Dow, S&P 500, Nasdaq rise to cap choppy week – Yahoo Finance” https://finance.yahoo.com/news/live/stock-market-today-friday-july-10-dow-sp-nasdaq-113921604.html Accessed on 13 July 2026.
[4] “US strikes Iran after ship attack in Strait of Hormuz – CNN” https://www.cnn.com/2026/07/11/world/live-news/iran-war-trump Accessed on 13 July 2026.
[5] “Crude Oil – Price – Chart – Historical Data – News – Trading Economics” https://tradingeconomics.com/commodity/crude-oil Accessed on 13 July 2026.
[6] “CPI Home – U.S. Bureau of Labor Statistics” https://www.bls.gov/cpi/ Accessed on 13 July 2026.
[7] “Dow Jones Industrial Average Historical Data (DJI) – Investing.com” https://www.investing.com/indices/us-30-historical-data Accessed on 13 July 2026.
