


[DAILY TRADING] XAUUSD Analysis 13 July 2026 – Gold Price Today Falls to $4,050 as XAUUSD Chart Turns Bearish Before US CPI

Vantage Editorial Team >
Vantage Editorial Team >
Vantage is a global, multi-asset broker with a team of in-house writers and market analysts who produce educational and insightful trading content for traders of all levels.
 Updated Mon, 2026 July 13 06:59
![[DAILY TRADING] XAUUSD Analysis 13 July 2026 – Gold Price Today Falls to $4,050 as XAUUSD Chart Turns Bearish Before US CPI](https://www.vantagemarkets.com/wp-content/uploads/2026/06/XAUUSD_banner_900x430_optimized-3.webp)
The gold price today sits at $4,050.95 on the Vantage XAUUSD CFD as of 13:44 (GMT+8), 05:44 UTC, on 13 July 2026, a roughly two-week low. This XAUUSD technical analysis shows price sitting near the support shelf tested on 8 July, per the XAUUSD TradingView setup used for this analysis, with tomorrow’s US inflation data on deck.
Key points
- Gold on the Vantage XAUUSD CFD fell to $4,050.95 during the Asia session, a level that matches the swing low from 8 July 2026 on the chart used for this analysis.
- The 50-period moving average has turned decisively lower and the 200-period average has begun rolling over, with price trading beneath both at 4,102.43 and 4,080.71 respectively.
- The Relative Strength Index sits at 38.52 against its moving-average overlay of 38.43, in bearish territory but not yet at an oversold extreme, ahead of Tuesday’s US CPI release.
What the XAUUSD chart is showing
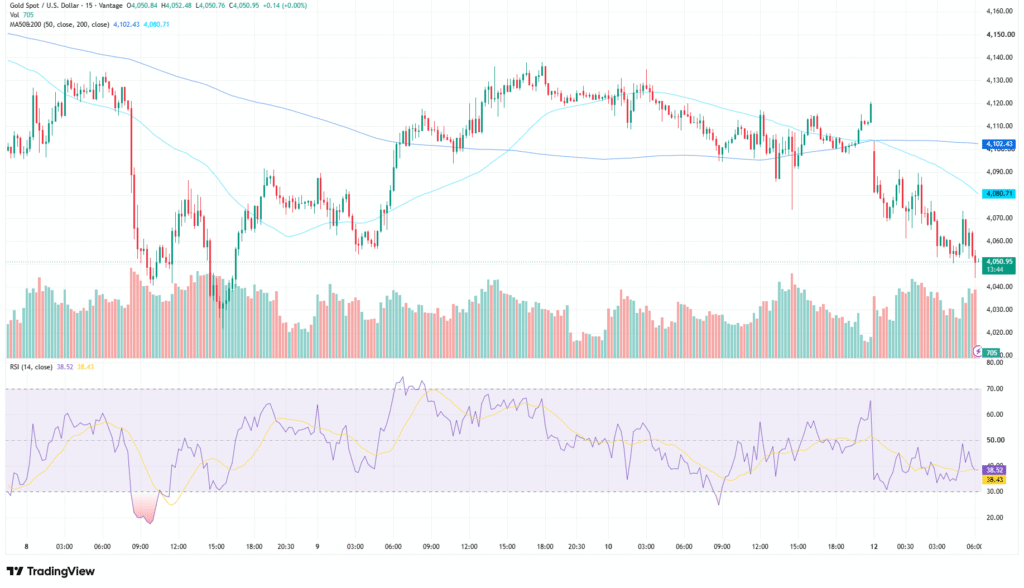
The 15-minute XAUUSD chart shows gold’s slide extending from a session high near 4,140 on 9 to 10 July 2026 down to the current 4,050.95 print, a decline of roughly 90 points over four sessions. Price broke through the 200-period moving average at 4,080.71 first, then the 50-period average at 4,102.43; the 50-period average has turned decisively lower while the 200-period average has only begun rolling over, per the TradingView setup used for this analysis.
Gold also weakened across broader benchmark markets during the same period, easing to around $4,070 on 12 July 2026, down roughly 1.2% on the day and part of a monthly decline of more than 5%[6], consistent with the multi-session pullback on the Vantage feed.
The Relative Strength Index (14) reads 38.52 against its moving-average overlay of 38.43, based on the TradingView setup used for this analysis. That places momentum in bearish territory without reaching the oversold extreme seen when the RSI dipped toward 20 during the 8 July session. See all latest gold price news here.
Volume on the Vantage CFD feed has stayed moderate through the decline, pointing to a steady grind lower rather than a single-session shock. Price also lines up closely with the 8 July 2026 reference level, suggesting sellers are retesting that zone.
The macro backdrop: inflation data and the Middle East conflict
The Federal Reserve held its benchmark rate at 3.50% to 3.75% at its 16 to 17 June 2026 meeting under new Chair Kevin Warsh, with the statement citing inflation that remains elevated relative to the Committee’s 2% goal, partly reflecting energy-related supply pressures[1].
Minutes from that meeting, released 8 July 2026, showed the committee split on the outlook: some participants saw a case for a rate increase later this year, while others favoured holding steady[2].
Speaking days later, Warsh said inflation expectations and risks had eased somewhat, though he repeated the Fed’s commitment to its 2% target[3][4]. Markets are pricing a meaningful probability of a rate move by September[5], though the outlook remains sensitive to this week’s data.
Despite ongoing geopolitical risk, easing oil prices and positioning ahead of tomorrow’s CPI report have outweighed safe-haven demand tied to the Middle East conflict. Markets remain focused on that report, while geopolitical developments continue to influence inflation expectations at the margin.
On the demand side, China’s central bank added 480,000 troy ounces, around 14.93 tonnes, of gold to its reserves in June 2026[7], extending its buying streak to 20 consecutive months, the longest on record since 2015, a reminder that official-sector demand is watched alongside the technical picture.

Levels to watch and this week’s gold price news
The table below sets out the levels traders are watching on the Vantage XAUUSD CFD, based on the chart used for this analysis. These are reference points, not trade signals.
| Pair | Support | Resistance | What’s happening |
| XAUUSD | 4,050.95 | 4,080.71 / 4,102.43 | Trading at the lower end of the recent range, retesting the 8 July support shelf |
Table 1: Key levels as of 13:44 (GMT+8), 13 July 2026. Source: TradingView setup used for this analysis. Indicative only.
Monitor gold price news this week for updates around a dense US data calendar[8]:
- US CPI, 14 July 2026: June’s Consumer Price Index is due at 8:30am ET, the last major inflation print before the Fed’s 28 to 29 July meeting.
- US PPI, 15 July 2026: Producer prices follow a day later, rounding out the inflation picture.
- Jobless Claims, 16 July 2026: A read on labour market momentum after June’s softer payrolls figure.
- Michigan Sentiment, 17 July 2026: Consumer inflation expectations close out the week.
- FOMC Meeting, 28 to 29 July 2026: The next scheduled rate decision, which this week’s data feeds into directly.
On risk management: with gold beneath both moving averages and retesting a support shelf for a second time this week, standard intraday range assumptions carry less weight than usual. Traders often monitor the $4,050 support area and the $4,080 to $4,102 resistance zone closely in data-heavy weeks like this, since price reaction there can shape overall exposure. Stop Loss discipline around these zones limits losses to a planned size rather than preventing them outright.
Leverage works both ways, amplifying gains and losses alike. Position sizing relative to account equity is worth revisiting ahead of Tuesday’s CPI print, particularly for anyone holding leveraged exposure to gold or correlated USD instruments.

RISK WARNING: CFDs are complex financial instruments and carry a high risk of losing money rapidly due to leverage. You should ensure you fully understand the risks involved and carefully consider whether you can afford to take the high risk of losing your money before trading.
Disclaimer: The information is provided for educational purposes only and doesn’t take into account your personal objectives, financial circumstances, or needs. It does not constitute investment advice. We encourage you to seek independent advice if necessary. The information has not been prepared in accordance with legal requirements designed to promote the independence of investment research. No representation or warranty is given as to the accuracy or completeness of any information contained within. This material may contain historical or past performance figures and should not be relied on. Furthermore estimates, forward-looking statements, and forecasts cannot be guaranteed. The information on this site and the products and services offered are not intended for distribution to any person in any country or jurisdiction where such distribution or use would be contrary to local law or regulation.
References
[1] “Federal Reserve issues FOMC statement – Federal Reserve” https://www.federalreserve.gov/newsevents/pressreleases/monetary20260617a.htm Accessed on 13 July 2026.
[2] “Minutes of the Federal Open Market Committee, June 16-17, 2026 – Federal Reserve” https://www.federalreserve.gov/monetarypolicy/fomcminutes20260617.htm Accessed on 13 July 2026.
[3] “Gold gains over 2% after soft jobs data, Fed Chair Warsh’s comments – CNBC” https://www.cnbc.com/2026/07/01/gold-prices-slip-as-firmer-treasury-yields-fed-rate-outlook-weigh.html Accessed on 13 July 2026.
[4] “Gold Holds Gain After Warsh Remarks Ease Fed Rate-Hike Prospects – Bloomberg via Yahoo Finance” https://finance.yahoo.com/markets/commodities/articles/gold-holds-gain-warsh-remarks-002854520.html Accessed on 13 July 2026.
[5] “FedWatch – CME Group” https://www.cmegroup.com/markets/interest-rates/cme-fedwatch-tool.html Accessed on 13 July 2026.
[6] “Gold – Price – Chart – Historical Data – News – Trading Economics” https://tradingeconomics.com/commodity/gold Accessed on 13 July 2026.
[7] “China’s PBOC Buys Most Gold Since 2023 as Bullion Swings – Bloomberg” https://www.bloomberg.com/news/articles/2026-07-07/china-s-pboc-buys-most-gold-since-2023-as-bullion-swings Accessed on 13 July 2026.
[8] “US CPI Report July 2026: Date, Time and What to Expect – Finance Calendar” https://www.financecalendar.com/event/us-cpi-report-july-2026/ Accessed on 13 July 2026.
