


[DAILY TRADING] TSM Analysis 20 July 2026 — Record Earnings Meet a Bigger Capex Bill

Vantage Editorial Team >
Vantage Editorial Team >
Vantage is a global, multi-asset broker with a team of in-house writers and market analysts who produce educational and insightful trading content for traders of all levels.
 Updated Mon, 2026 July 20 08:46
![[DAILY TRADING] TSM Analysis 20 July 2026 — Record Earnings Meet a Bigger Capex Bill](https://www.vantagemarkets.com/wp-content/uploads/2026/07/ChatGPT-Image-Jul-20-2026-04_43_28-PM.webp)
As of 16:15 (GMT+8) / 08:15 UTC on 20 July 2026, ahead of the Monday cash-market open, the Vantage TSM CFD was indicated near $403.82 in pre-market trade, building on Friday’s regular-session close of $398.08. That close sat below both moving averages plotted on the chart used for this analysis, the first full session since Taiwan Semiconductor Manufacturing Company’s record second-quarter earnings release rattled the AI-chip trade.
This piece reads the chart and the week’s news flow. It does not call the trade. All prices below are past or present readings only, and this is not financial advice.
Key Points
- The Vantage TSM CFD was indicated near $403.82 in Monday pre-market trade, building on Friday’s regular-session close of $398.08, itself still below both the 50-period and 200-period moving averages on the chart used for this analysis.
- Taiwan Semiconductor’s second-quarter results, reported on 16 July 2026, showed revenue of $40.20 billion and net income up 77% year-on-year, yet shares moved lower across the sessions that followed as investors focused on a larger 2026 capital-spending plan.1,2
- The company raised its 2026 capital expenditure guidance to a $60 billion to $64 billion range from $52 billion to $56 billion and confirmed an additional $100 billion investment in Arizona, taking its cumulative US commitment to $265 billion.2,3
What the Chart Is Showing
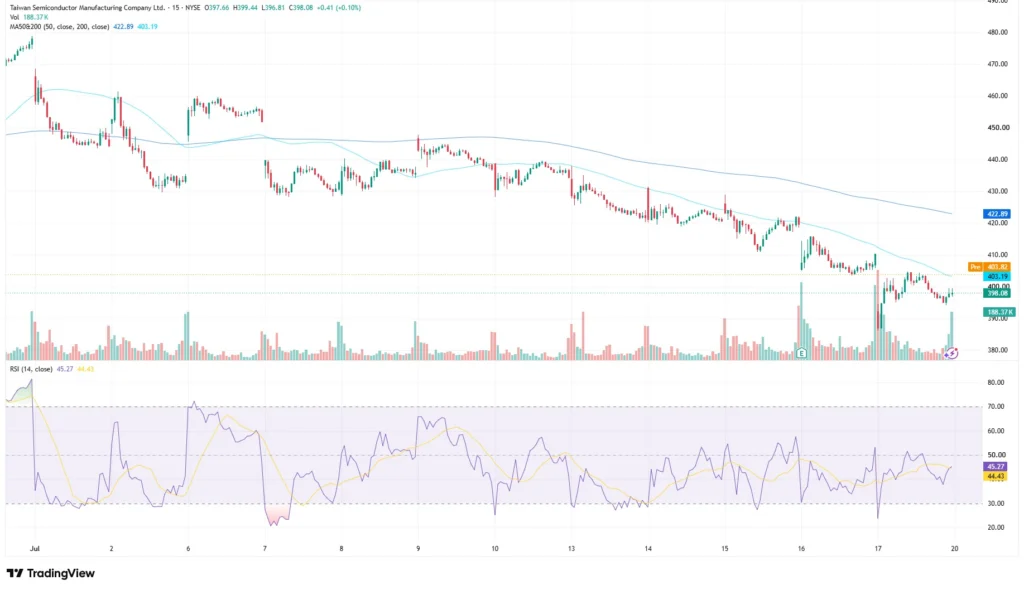
TSM has spent July in a broad decline. The chart used for this analysis opens the month near $465 and traces a fall to the $390s by mid-month, interrupted only by a brief recovery attempt around 6 July 2026 that faded within days.
A volume spike appears around 16 and 17 July 2026 on the Vantage CFD feed, coinciding with the earnings release, before tapering into Monday’s session.1
The 50-period moving average reads 422.89 and the 200-period moving average reads 403.19 on the TradingView setup used for this analysis. The two lines have not crossed, and price has traded under both since early July, including through Friday’s $398.08 close and Monday’s pre-market indication of $403.82.
The Relative Strength Index (RSI) on the TradingView setup used for this analysis reads 45.27, with its moving-average overlay at 44.43. Both sit under the 50 midline, off the low near 30 registered around 16 to 17 July, and neither is at an overbought or oversold extreme. See all latest stock market news today here.
The Record Quarter That Still Sent Shares Lower

Taiwan Semiconductor reported second-quarter revenue of $40.20 billion on 16 July 2026, up 36% year-on-year and at the top of the company’s own guidance range. Net income rose 77% year-on-year to a record NT$706.6 billion (about $22 billion), beating the market’s forecast.1
Management also raised its full-year 2026 revenue growth guidance to “slightly above 40%” in US dollar terms, up from a prior “above 30%,” and guided third-quarter revenue toward $44.6 billion to $45.8 billion.2
Shares still moved lower across the sessions that followed. Coverage attributed the reaction to a higher 2026 capital expenditure plan, raised to a $60 billion to $64 billion range from $52 billion to $56 billion, alongside a further $100 billion commitment to Arizona that takes the company’s cumulative US investment to $265 billion.2,3
Other coverage framed the reaction as a reset of near-term free cash flow expectations rather than a demand problem.5,6
Chairman C.C. Wei told the earnings call that customer demand signals remained strong, adding: “Our conviction in the multi-year AI megatrend remains very high.”2
Levels Traders Are Watching
The table below sets out the levels referenced across the chart and the wider coverage of this week’s move. These are reference levels only, not trade instructions.
| Level | Price ($) | What it means |
| 50-period MA | 422.89 | Higher of the two moving averages on the chart; price has stayed under it since early July |
| 200-period MA | 403.19 | Sits just above Monday’s pre-market indication; the two averages have not crossed |
| Resistance zone (external) | 420.00 – 431.00 | Zone flagged by other market commentary following the earnings reaction |
| Support zone (external) | 397.00 – 407.00 | Zone flagged by other market commentary following the earnings reaction |
| 20 July session low | 396.81 | Recorded on the chart used for this analysis |
| 20 July session high | 399.44 | Recorded on the chart used for this analysis |
Levels sourced from the TradingView setup used for this analysis and FX Leaders7. Accessed on 20 July 2026. Indicative only.
What to Watch This Week
- Analyst Revisions, Ongoing: Sell-side estimate changes following the Q2 print, including TD Cowen’s revised valuation of $440, up from $400, remain a swing factor for sentiment.
- Q3 Results, Mid-October: TSMC’s next scheduled update will show whether the raised capital-spending plan is translating into the third-quarter growth management guided toward.
- Sector Read-Through, Ongoing: Moves in other AI-linked chip names have tracked TSM closely since the earnings reaction, and that correlation is worth monitoring alongside the stock itself.
- US Manufacturing Build-Out, Multi-Year: The additional Arizona investment adds to an already large build-out; any update on timing or scope could move sentiment on the capex debate.
TSM has moved through a wide range over the past three weeks, from the mid-$460s to under $390 and back above $400 in pre-market trade. Stop Loss placement is worth revisiting given this volatility, and market participants often monitor levels such as the 200-period moving average near $403 and the $397 to $407 zone flagged elsewhere as reference points rather than fixed lines. A Stop Loss limits losses to a planned size; it does not remove the risk of a gap through that level in a fast-moving session.7
Leverage works both ways on a stock that has swung more than 15% in three weeks, and it remains a double-edged tool rather than a feature to be maximised. Position sizing relative to account equity is worth revisiting ahead of TSMC’s next scheduled update, particularly for accounts holding correlated exposure across other semiconductor CFDs.

RISK WARNING: CFDs are complex financial instruments and carry a high risk of losing money rapidly due to leverage. You should ensure you fully understand the risks involved and carefully consider whether you can afford to take the high risk of losing your money before trading.
Disclaimer: The information is provided for educational purposes only and doesn’t take into account your personal objectives, financial circumstances, or needs. It does not constitute investment advice. We encourage you to seek independent advice if necessary. The information has not been prepared in accordance with legal requirements designed to promote the independence of investment research. No representation or warranty is given as to the accuracy or completeness of any information contained within. This material may contain historical or past performance figures and should not be relied on. Furthermore estimates, forward-looking statements, and forecasts cannot be guaranteed. The information on this site and the products and services offered are not intended for distribution to any person in any country or jurisdiction where such distribution or use would be contrary to local law or regulation.
References
[1] “TSMC Second-Quarter Profit Soars 77% to Record on AI Demand – CNBC” https://www.cnbc.com/2026/07/16/tsmc-second-quarter-profit-.html Accessed on 20 July 2026.
[2] “TSMC to Invest Another $100 Billion in US as Q2 Profit Blows Past Forecasts – Reuters, via Yahoo Finance” https://finance.yahoo.com/technology/ai/articles/tsmc-invest-another-100-billion-100633089.html Accessed on 20 July 2026.
[3] “TSM Stock Price – Taiwan Semiconductor – Morningstar” https://www.morningstar.com/stocks/xnys/tsm/quote Accessed on 20 July 2026.
[4] “Taiwan Semiconductor Manufacturing Company Limited (TSM) Stock Price, News, Quote & History – Yahoo Finance” https://finance.yahoo.com/quote/TSM/ Accessed on 20 July 2026.
[5] “Why is TSMC Stock Falling Despite Record Q2 Earnings? – Invezz” https://invezz.com/news/2026/07/16/why-is-tsmc-stock-falling-despite-record-q2-earnings/ Accessed on 20 July 2026.
[6] “TSMC and AI Stocks Fall Despite Upbeat Earnings – Investing.com, via Yahoo Finance” https://finance.yahoo.com/markets/stocks/articles/tsmc-ai-stocks-fall-despite-092548219.html Accessed on 20 July 2026.
[7] “TSM Stock Slips 2.3% Despite Record Profit as AI Demand Meets Capex Concerns – FX Leaders” https://www.fxleaders.com/news/2026/07/17/tsm-stock-slips-2-3-despite-record-profit-as-ai-demand-meets-capex-concerns/ Accessed on 20 July 2026.
[8] “Capex Concerns Drag Taiwan Semiconductor Stock to 6th-Straight Loss – Schaeffer’s Investment Research” https://www.schaeffersresearch.com/content/news/2026/07/16/capex-concerns-drag-taiwan-semiconductor-stock-to-6th-straight-loss Accessed on 20 July 2026.
[9] “TD Cowen Raises TSMC Price Target to $440 from $400 – TipRanks, via Robinhood” https://robinhood.com/us/en/stocks/TSM/ Accessed on 20 July 2026.
