


[DAILY TRADING] DJ30 Analysis 20 July 2026 – Dow Jones Today Holds 52,164 as Middle East Risk Flares Back Up

Vantage Editorial Team >
Vantage Editorial Team >
Vantage is a global, multi-asset broker with a team of in-house writers and market analysts who produce educational and insightful trading content for traders of all levels.
 Updated Mon, 2026 July 20 06:20
![[DAILY TRADING] DJ30 Analysis 20 July 2026 – Dow Jones Today Holds 52,164 as Middle East Risk Flares Back Up](https://www.vantagemarkets.com/wp-content/uploads/2026/06/DJ30_hero_18Jun2026.webp)
Dow Jones today: as of 13:19 (GMT+8) / 05:19 UTC on 20 July 2026, the Vantage DJ30 CFD is sitting almost exactly where it left off on Friday, at 52,164.45, down a token 10.00 points (-0.02%) after opening at 52,173.45. Quiet numbers for a weekend that was anything but. The current Dow Jones index level barely hints at how turbulent markets tied to the Middle East have been over the past 48 hours.
What the DJ30 chart is showing
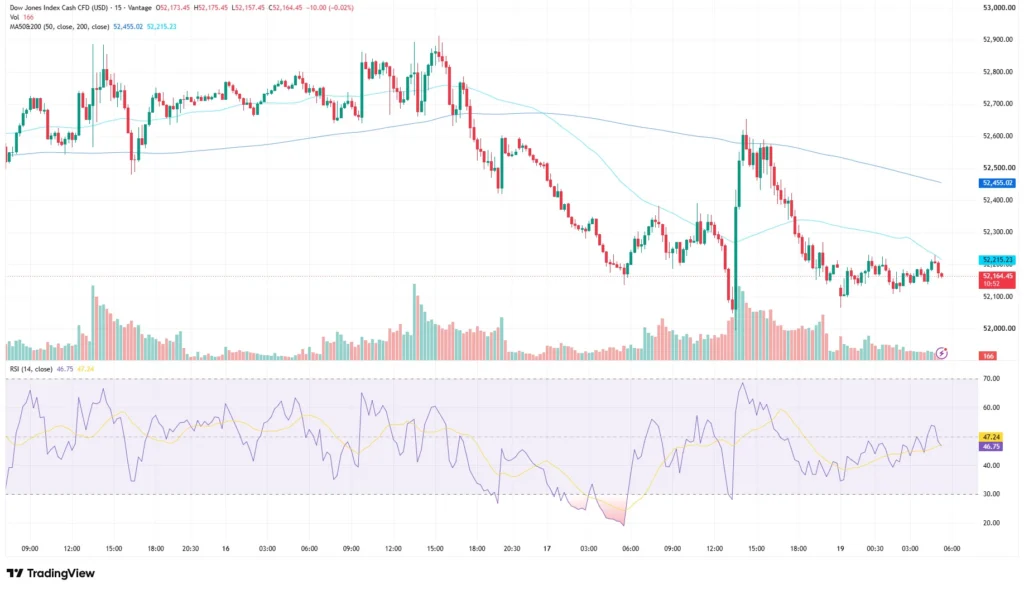
On the five-day, 15-minute chart, the picture is a lot more dramatic than today’s flat open suggests. DJ30 touched a swing high near 52,900 in the 15 July 2026 session, then rolled over hard into 16 and 17 July 2026. Friday’s session did most of the damage: the day’s range spanned 51,986.74 to 52,610.97, and the Relative Strength Index (RSI) on the TradingView setup used for this analysis dropped into the low 20s, properly oversold territory on this Dow Jones index chart.1
Then came the weekend twist. The chart shows a sharp gap and spike as the index reopened, with the RSI rocketing from the low 20s back toward the low 60s within hours. That bounce has since drained away through Monday’s Asian session, leaving price back at 52,164.45 and the RSI at an unremarkable 46.75, alongside a 47.24 reading on its moving-average overlay, per the TradingView setup used for this analysis. Neither number is telling much of a story right now, which is a story in itself.
The 50-period moving average sits at 52,455.02 and the 200-period moving average at 52,215.23, both read directly off the chart header on closing price. Price remains just below the 200-period moving average while still well beneath the 50-period moving average, indicating that the broader short-term trend remains under pressure.
Read the latest DJ30 news here.
Why the Dow Jones index is trading here

Friday’s slide reflected a combination of technology-sector weakness, AI-related sentiment, and broader risk repositioning. Chinese AI developer Moonshot AI released a model it said narrows the gap with leading US labs, and chip-linked Dow Jones stocks sold off hard in response. That rotation coincided with the Dow’s 406.55-point, or 0.77%, decline to 52,146.42, and the VanEck Semiconductor ETF booked its third weekly decline in four weeks.2
The weekend’s bigger story, though, has been the Middle East conflict. Reports over the weekend pointed to renewed hostilities affecting shipping conditions around the Strait of Hormuz and an incident at a Gulf oil facility, and Brent crude jumped above $90 a barrel, its highest level since mid-June, with West Texas Intermediate trading near $84. Higher oil prices added another layer of uncertainty for equity investors, though the connection to any single index move is rarely a straight line.3
And yet, US index futures barely blinked heading into Monday’s open: Dow futures roughly flat, S&P 500 and Nasdaq-100 futures a touch firmer. For a headline that serious, that is a notably restrained reaction, and it says something about how much of this risk markets had already priced in before the weekend even started.4
Layer on a genuinely heavy earnings week and there is plenty left for this Dow Jones share index to digest. Tesla and Alphabet both report second-quarter numbers Wednesday, 22 July, with General Motors a day earlier, and any of the three could reset sentiment across the wider Dow Jones stock price picture by Thursday.5
Dow Jones levels to watch
The table below reflects the zones traders are watching on DJ30 right now, as of the cut-off above. These are reference levels, not trade signals.
| Level | Price | What’s happening |
| Resistance 3 | 52,900 | 15 July swing high visible on the chart |
| Resistance 2 | 52,455 | 50-period moving average, declining |
| Resistance 1 | 52,215 | 200-period moving average, declining |
| Current price | 52,164 | Trading below both moving averages |
| Support 1 | 51,987 | Friday’s session low |
Table 1: DJ30 levels as of 13:19 (GMT+8) / 05:19 UTC on 20 July 2026. Sources: TradingView, Investing.com. Indicative only.
What to watch this week
- Tesla and Alphabet earnings, 22 July 2026: Two of the more closely watched technology-linked reports this quarter land after Wednesday’s close, with the potential to shift risk appetite into Thursday’s session.5
- Strait of Hormuz developments: Any further disruption to shipping conditions in the Gulf, or conversely any sign of de-escalation, could move oil prices and, by extension, broader risk sentiment.3
- Semiconductor sector positioning: Chip-linked names have been choppy after Taiwan Semiconductor raised its spending forecast the same week Moonshot AI’s model release rattled the sector; further positioning here may continue to spill into the wider index.6
- General Motors earnings, 21 July 2026: An early read on how tariffs and demand trends are affecting one of the index’s industrial components.5
DJ30 has moved through a wide range over the past five sessions, from a high near 52,900 to a low near 51,987, with a weekend gap wedged in between. Traders are likely to focus first on the 50-period moving average as immediate resistance, while the 200-period moving average remains the next major technical hurdle. A Stop Loss limits losses to a planned size rather than preventing them altogether, particularly when a position spans a weekend or a geopolitical headline.
Leverage works both ways in this kind of headline-driven, gap-prone environment, amplifying gains and losses alike. Position sizing relative to account equity is worth revisiting ahead of Wednesday’s earnings and any fresh Dow Jones news out of the Middle East, especially for traders holding DJ30 alongside other US equity or oil-correlated CFD positions.
RISK WARNING: CFDs are complex financial instruments and carry a high risk of losing money rapidly due to leverage. You should ensure you fully understand the risks involved and carefully consider whether you can afford to take the high risk of losing your money before trading.
Disclaimer: The information is provided for educational purposes only and doesn’t take into account your personal objectives, financial circumstances, or needs. It does not constitute investment advice. We encourage you to seek independent advice if necessary. The information has not been prepared in accordance with legal requirements designed to promote the independence of investment research. No representation or warranty is given as to the accuracy or completeness of any information contained within. This material may contain historical or past performance figures and should not be relied on. Furthermore estimates, forward-looking statements, and forecasts cannot be guaranteed. The information on this site and the products and services offered are not intended for distribution to any person in any country or jurisdiction where such distribution or use would be contrary to local law or regulation.
References
[1] “Dow Jones Industrial Average Historical Data (DJI) – Investing.com” https://www.investing.com/indices/us-30-historical-data Accessed on 20 July 2026.
[2] “Stock market news for July 17, 2026 – CNBC” https://www.cnbc.com/2026/07/16/stock-market-today-live-updates.html Accessed on 20 July 2026.
[3] “Brent Oil Tops $90 as Middle East Attacks Threaten Hormuz Flows – Bloomberg” https://www.bloomberg.com/news/articles/2026-07-19/latest-oil-market-news-and-analysis-for-july-20 Accessed on 20 July 2026.
[4] “Stock futures are little changed after Wall Street suffers losing week: Live updates – CNBC” https://www.cnbc.com/2026/07/19/stock-market-today-live-updates.html Accessed on 20 July 2026.
[5] “Earnings playbook: Alphabet and Tesla are among the big companies set to report this week – CNBC” https://www.cnbc.com/2026/07/19/earnings-playbook-alphabet-tesla-headline-this-weeks-big-reports.html Accessed on 20 July 2026.
[6] “Stock market news for July 16, 2026 – CNBC” https://www.cnbc.com/2026/07/15/stock-market-today-live-updates.html Accessed on 20 July 2026.
