[DAILY TRADING] TER Stock Price Analysis 30 June 2026 – Teradyne Holds the 50-Day MA After Nasdaq-100 Pullback
Vantage Editorial Team >
Vantage Editorial Team >
Vantage is a global, multi-asset broker with a team of in-house writers and market analysts who produce educational and insightful trading content for traders of all levels.
![[DAILY TRADING] TER Stock Price Analysis 30 June 2026 – Teradyne Holds the 50-Day MA After Nasdaq-100 Pullback](https://www.vantagemarkets.com/wp-content/uploads/2026/06/ChatGPT-Image-Jun-30-2026-05_16_58-PM.webp)
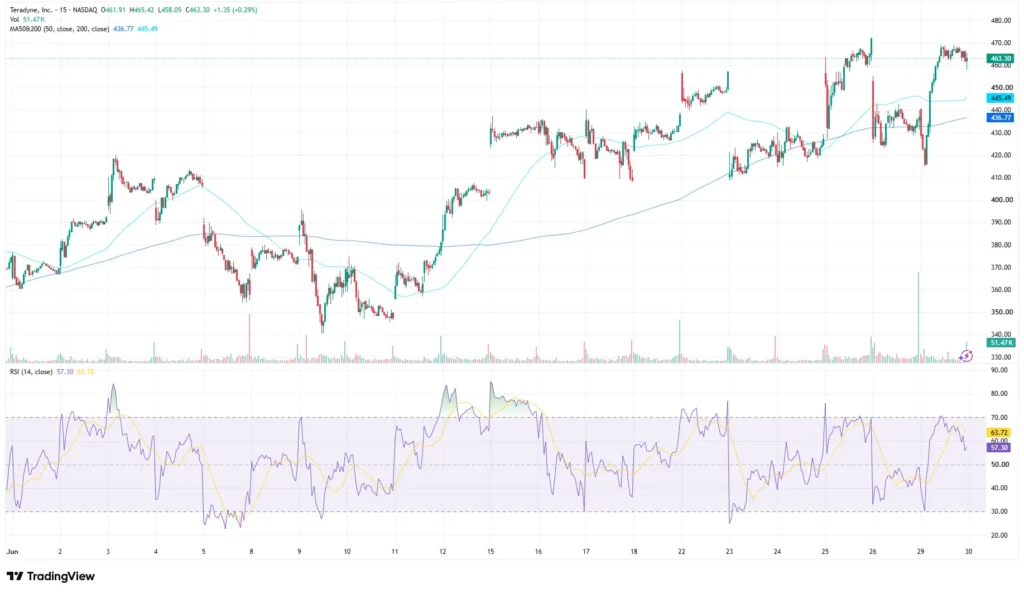
Teradyne, Inc. (NASDAQ: TER) stock price traded at $463.30, up 0.29% on the session, as of 15:00 (GMT+8) on 30 June 2026. Teradyne stock has had a busy June. The Teradyne inc share price joined the Nasdaq-100 Index on 22 June 2026[1], then rallied to a fresh 52-week high around $472 before pulling back sharply during the following sessions[2]. The session in view shows TER stock stabilising above both moving averages, with momentum cooling from overbought territory.
All price references in this Teradyne news update are taken from the Vantage TER CFD chart as of this cut-off time unless stated otherwise. Charts are indicative and from TradingView. This is not financial advice.
Key Points
- TER stock price traded at $463.30 as of 15:00 (GMT+8) on 30 June 2026, sitting above both its 200-day MA ($445.49) and 50-day MA ($436.77) on the chart used for this analysis.
- The Teradyne stock ran to a 52-week high followed its addition to the Nasdaq-100 Index on 22 June 2026[1], and a string of price target increases from BofA Securities and Cantor Fitzgerald[2].
- The RSI on the TradingView setup used for this analysis last read 57.30, down from a peak above 80 in mid-June, with the earlier overbought condition unwinding without a corresponding breakdown in price.
What the TER Stock Price Chart Is Showing
The 15-minute chart for Teradyne CFD opened at $461.91, reached a session high of $465.42 and a session low of $458.05, before settling at $463.30 as of the cut-off time. Session volume on the Vantage CFD feed read 51.47K for the bar in view.
Zooming out to June, price action has had two phases. The first half saw consolidation roughly between $345 and $410, with a notable spike low near $345 on heavy volume. From mid-June, a sharp uptrend carried the stock above $450, then to a fresh 52-week high around $472 around 25 to 26 June 2026, before a steep pullback took it back toward the $420s. The latest rebound has carried price back into the upper end of its recent trading range, although it remains below the June highs.
The 200-day MA on the TradingView setup used for this analysis reads 445.49, while the 50-day MA reads 436.77, both trending higher with price sitting above both. The RSI (14) last read 57.30, with its moving-average overlay at 63.72, down from readings above 70 in mid-June. That easing, rather than a sharp drop, is the more notable detail for this TER stock forecast. Read this guide to learn everything you need to know about the basics of technical analysis.
Teradyne News: Why TER Stock Has Been in Focus This Month

Teradyne’s June was shaped by an index event and a wave of analyst re-ratings rather than a single earnings catalyst. Nasdaq confirmed Teradyne’s addition to the Nasdaq-100 Index effective 22 June 2026, alongside four other AI infrastructure additions[1]. Index inclusion typically brings mechanical buying from funds tracking the benchmark, adding a technical tailwind independent of company fundamentals.
That tailwind coincided with a string of price target increases. BofA Securities raised its target to $525 from $365, and Cantor Fitzgerald raised its target to $550 from $400[2], both citing the AI infrastructure buildout. Coverage also linked part of the move to strength reported by customer Micron Technology, a positive signal for test equipment demand[3]. Teradyne also added a test cell solution with Tokyo Electron, and secured a multi-year US Air Force contract[4].
Commentary following the pullback has flagged valuation and insider-selling activity as areas market participants are watching, alongside the stock’s stretched earnings multiple after its rapid year-to-date advance[5].
Levels to Watch
The table below sets out levels visible on the chart used for this analysis. These are reference points traders are watching, not trade signals.
| Level | Price | Type | What it represents |
| MA50 | 445.49 | Dynamic support | Short-term trend reference traders are watching |
| MA200 | 436.77 | Dynamic support | Longer-term trend reference, sits below MA50 |
| Session high | 465.42 | Resistance area | Intraday high on the chart as of the cut-off time |
| Session low | 458.05 | Support area | Intraday low on the chart as of the cut-off time |
Levels above are read from the Vantage TER CFD chart (TradingView setup). TradingView. Data referenced as of 30 June 2026, 15:00 (GMT+8).
With price holding above both moving averages, the 50-day MA near 445.49 is the level traders are watching most closely as nearer dynamic support. A daily close back below that, followed by a test of the 200-day MA near 436.77, would mark a shift in the short-term picture. On the upside, the session high near 465.42 and the 52-week high around 472 remain the references for recent selling pressure.
What to Watch This Week
- ISM Manufacturing PMI, 1 July 2026: A broad read on US industrial activity feeding into sentiment across semiconductor-equipment names.
- Nonfarm Payrolls, 2 July 2026: A stronger or weaker print can move risk appetite across the wider tech and semiconductor complex Teradyne trades within.
- Teradyne Q2 2026 Earnings, 28 July 2026: The next scheduled update on whether AI-related test demand is tracking the guidance management gave with Q1 results.
On risk management: TER stock has shown a wide intraday range over the past two weeks, including a steep pullback from its 52-week high. Many traders monitor the moving averages as potential reference levels when determining risk parameters, although no technical level guarantees support or resistance.
Leverage applied to a CFD position on a stock with this volatility works both ways, amplifying gains and losses alike. Position sizing relative to total account equity is worth revisiting ahead of the Q2 earnings date and the shortened US holiday week.

RISK WARNING: CFDs are complex financial instruments and carry a high risk of losing money rapidly due to leverage. You should ensure you fully understand the risks involved and carefully consider whether you can afford to take the high risk of losing your money before trading.
Disclaimer: The information is provided for educational purposes only and doesn’t take into account your personal objectives, financial circumstances, or needs. It does not constitute investment advice. We encourage you to seek independent advice if necessary. The information has not been prepared in accordance with legal requirements designed to promote the independence of investment research. No representation or warranty is given as to the accuracy or completeness of any information contained within. This material may contain historical or past performance figures and should not be relied on. Furthermore estimates, forward-looking statements, and forecasts cannot be guaranteed. The information on this site and the products and services offered are not intended for distribution to any person in any country or jurisdiction where such distribution or use would be contrary to local law or regulation.
References
[1] “Nasdaq-100 Index June 2026 Quarterly Changes – Nasdaq, Inc.” https://ir.nasdaq.com/news-releases/news-release-details/nasdaq-100-indexr-june-2026-quarterly-changes Accessed on 30 June 2026.
[2] “Teradyne price target raised to $525 from $365 at BofA – StockAnalysis / TipRanks” https://stockanalysis.com/stocks/ter/ Accessed on 30 June 2026.
[3] “Here’s Why Teradyne Shares Surged Higher Today (Hint: It’s AI and Micron-Related) – The Motley Fool” https://www.fool.com/investing/2026/06/25/heres-why-teradyne-shares-surged-higher-today-hint/ Accessed on 30 June 2026.
[4] “Teradyne Introduces Integrated Test Solution for AI and Data Center Devices in Collaboration with Tokyo Electron – Business Wire” https://www.businesswire.com/news/home/20260608994172/en/Teradyne-Introduces-Integrated-Test-Solution-for-AI-and-Data-Center-Devices-in-Collaboration-with-Tokyo-Electron/ Accessed on 30 June 2026.
[5] “Is Nasdaq-100 Inclusion and AI Defense Tailwinds Altering The Investment Case For Teradyne? – Simply Wall St” https://simplywall.st/stocks/us/semiconductors/nasdaq-ter/teradyne Accessed on 30 June 2026.
