[DAILY TRADING] XAUUSD Analysis 29 June 2026 – Gold Holds Near $4,062 as PCE Eases the Pressure
Vantage Editorial Team >
Vantage Editorial Team >
Vantage is a global, multi-asset broker with a team of in-house writers and market analysts who produce educational and insightful trading content for traders of all levels.
![[DAILY TRADING] XAUUSD Analysis 29 June 2026 – Gold Holds Near $4,062 as PCE Eases the Pressure](https://www.vantagemarkets.com/wp-content/uploads/2026/06/XAUUSD_banner_900x430_optimized-3.webp)
Gold is on track for a fourth consecutive weekly decline. The Vantage XAUUSD CFD is trading near $4,061.62 as of 05:35 UTC (13:35 GMT+8) on 29 June 2026, with the MA50 at $4,032.05 and the MA200 at $4,066.13 per the chart header.
Two forces are in tension. May PCE inflation – the Fed’s preferred gauge – came in at 4.1% year-on-year, broadly in line with consensus. [1] That modestly eased expectations for additional Fed tightening and gave gold a modest lift on Thursday. At the same time, markets continue to expect further Fed tightening during 2026, and new Fed Chair Kevin Warsh has reaffirmed the central bank’s commitment to bringing inflation under control. [2]
All prices reference the Vantage XAUUSD CFD. Charts sourced from TradingView. This is not financial advice.
Key Points
- XAUUSD price is near $4,061.62 as of 05:35 UTC (13:35 GMT+8) on 29 June 2026 – the fourth consecutive weekly decline, with the MA200 (200, close) at $4,066.13 acting as near-term overhead.
- May PCE inflation came in at 4.1% year-on-year, broadly matching expectations and modestly easing expectations for additional Fed tightening – though markets continue to expect further rate increases during 2026, with pricing shifting as geopolitical and inflation developments evolve.[1]
- Doha peace talks between the US and Iran are set to resume this week after both sides suspended hostilities. Oil prices have already retreated to near pre-conflict levels, easing one channel of energy-driven inflation pressure.[3]
XAUUSD chart: what the 15-minute setup shows
The XAUUSD TradingView chart for 23-28 June 2026 shows a clear sequence: a sustained decline from the mid-$4,100s on 23 June 2026 to a floor near $3,960 on 24 June 2026, a sharp bounce, and a recovery that has paused beneath the MA200. As of the cut-off time, the gold price today sits between the MA50 ($4,032.05) and MA200 ($4,066.13).
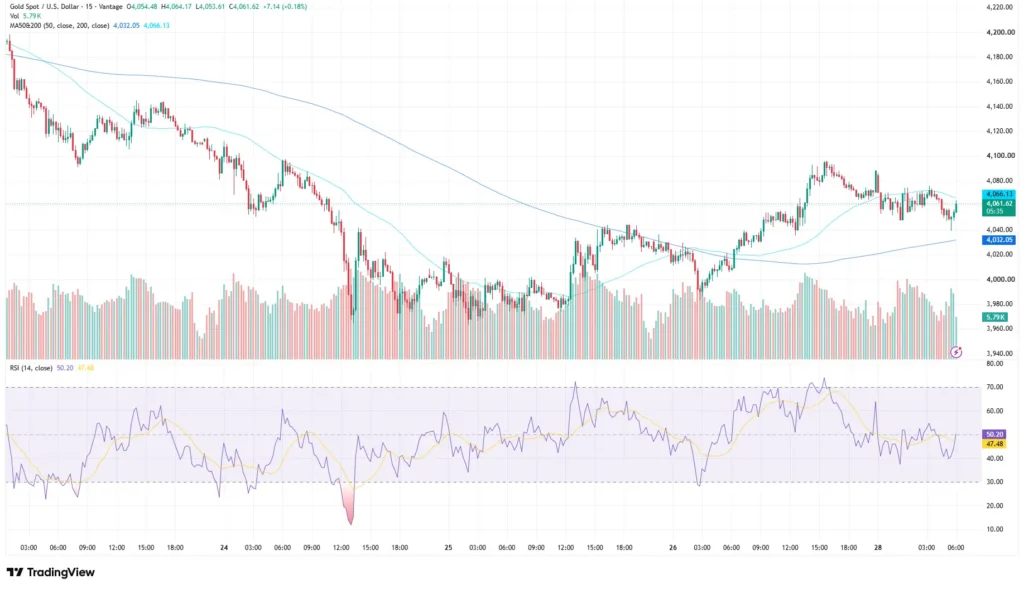
The RSI (14, close) according to the TradingView setup used for this analysis reads 50.20 on the main line and 47.48 on the moving average overlay – neutral territory with no clear momentum signal. This XAUUSD technical analysis of the 15-minute XAUUSD chart shows each push toward the $4,080-$4,100 zone on 26 June 2026 met selling, and the broader structure remains one of lower highs despite the recovery from last week’s lows. Saxo Bank’s head of commodity strategy Ole Hansen described the $4,000-$4,100 range as critical, noting a sustained break below it could trigger momentum-driven selling.[2]
What is driving gold prices today
Fed rate-hike expectations
The dominant XAUUSD news this week has been the Fed’s hawkish posture. Warsh reaffirmed the central bank’s inflation mandate, [2] and the Fed raised its 2026 PCE inflation projections. Gold, as a non-yielding asset, faces sustained headwinds when real rates are expected to stay elevated. Thursday’s in-line PCE print provided a modest floor – but with pricing for further tightening shifting as geopolitical and inflation developments evolve, [1] gold’s recovery has been limited.
Middle East tensions and oil
Geopolitical risk has been a two-way driver. Tensions escalated around 26 June 2026 with Iranian strikes on regional shipping and US retaliatory action, [3] but both sides agreed to suspend attacks ahead of Doha talks this week. Oil prices have retreated toward pre-conflict levels as a result.
For gold, the overall impact remains mixed: reduced inflation pressure competes with softer geopolitical demand, and lower oil can simultaneously ease Fed tightening expectations, weaken the dollar, and reduce safe-haven flows. JPMorgan noted that while the Middle East conflict reinforces longer-term themes driving gold demand, those themes are largely on hold until conflict resolution becomes clearer.[4] See all latest gold news here.
Key levels: XAUUSD technical analysis
Reference zones as of 05:35 UTC (13:35 GMT+8), 29 June 2026. These are observational levels, not trade signals. Monitor gold price news this week for updates from Doha and the 2 July NFP release.
| Pair | Support | Resistance | What traders are watching |
| XAUUSD | $3,960 / $4,032 | $4,066 / $4,100 | Consolidating between MA50 and MA200; RSI neutral at 50.20 |
Table 1: Key XAUUSD levels as of 05:35 UTC (13:35 GMT+8), 29 June 2026. Sources: Vantage XAUUSD CFD, TradingView. Indicative only.
What to watch
- US Non-Farm Payrolls, 2 July 2026: A strong jobs print would reinforce the hawkish Fed view and extend pressure on gold. A weak reading could revive rate-cut discussions.
- ISM Manufacturing PMI, 1 July 2026: An early read on US momentum for June. A weak print adds to stagflation concerns – historically a more constructive environment for gold even alongside elevated rates.
- Doha peace talks (ongoing): A credible resolution signal would ease energy inflation pressure, further trimming Fed hike bets and reducing the geopolitical risk premium currently embedded in gold prices.
Market participants often monitor Stop Loss levels around the $3,960 support and $4,066-$4,100 resistance zone. With gold news reacting to data releases and geopolitical headlines simultaneously, intraday ranges have been wider than typical in recent sessions.
Leverage amplifies moves in both directions. Gold has fallen more than 25% from its January 2026 all-time high near $5,602, [5] demonstrating how quickly leveraged positions can move against a trader. Position sizing relative to account equity is one factor market participants often consider ahead of high-impact data releases such as NFP.

RISK WARNING: CFDs are complex financial instruments and carry a high risk of losing money rapidly due to leverage. You should ensure you fully understand the risks involved and carefully consider whether you can afford to take the high risk of losing your money before trading.
Disclaimer: The information is provided for educational purposes only and doesn’t take into account your personal objectives, financial circumstances, or needs. It does not constitute investment advice. We encourage you to seek independent advice if necessary. The information has not been prepared in accordance with legal requirements designed to promote the independence of investment research. No representation or warranty is given as to the accuracy or completeness of any information contained within. This material may contain historical or past performance figures and should not be relied on. Furthermore estimates, forward-looking statements, and forecasts cannot be guaranteed. The information on this site and the products and services offered are not intended for distribution to any person in any country or jurisdiction where such distribution or use would be contrary to local law or regulation.
References
[1] “Gold – Price – Chart – Historical Data – News – Trading Economics” https://tradingeconomics.com/commodity/gold Accessed on 29 June 2026.
[2] “Gold tumbles below $4,000 over worries of Fed rate hikes – Yahoo Finance” https://finance.yahoo.com/markets/article/gold-tumbles-to-4000-over-worries-of-fed-rate-hikes-125357912.html Accessed on 29 June 2026.
[3] “Gold – Price – Chart – Historical Data – News – Trading Economics (29 June 2026 conflict and Doha talks entry)” https://tradingeconomics.com/commodity/gold Accessed on 29 June 2026.
[4] “Gold Price Predictions for 2026 and 2027 – J.P. Morgan Global Research” https://www.jpmorgan.com/insights/global-research/commodities/gold-prices Accessed on 29 June 2026.
[5] “XAUUSD Chart – Gold Spot US Dollar Price – TradingView” https://www.tradingview.com/symbols/XAUUSD/ Accessed on 29 June 2026.
