


Brent and WTI Crude Oil Weekly Analysis 21 July 2026 — Oil Prices Grind Higher as Middle East Risk Returns

Vantage Editorial Team >
Vantage Editorial Team >
Vantage is a global, multi-asset broker with a team of in-house writers and market analysts who produce educational and insightful trading content for traders of all levels.
 Updated Wed, 2026 July 22 01:59
Brent crude traded at $88.57 and WTI at $82.69 as of 03:41 UTC (11:41 GMT+8) and 03:42 UTC (11:42 GMT+8) respectively on 21 July 2026, according to the Vantage CFD feed. Both benchmarks are sitting just below Monday’s session highs, but the more interesting story is where they came from. Two weeks ago, Brent was trading in the mid-$70s.
Then the ceasefire that had briefly calmed the Middle East conflict came apart. Washington and Tehran signed a memorandum of understanding in mid-June to ease hostilities and restore shipping through the Strait of Hormuz.1 By early July, that understanding had unravelled, and crude has been grinding higher since, with a fresh escalation over the weekend adding a new front to the story.
This piece covers what the Brent and WTI charts show this week, why the risk premium keeps rebuilding, and the levels traders are watching into the next few sessions. Charts are indicative and from TradingView. This is not financial advice.
Key points
- Brent crude (UKOUSD) traded near $88.57 and WTI (USOUSD) near $82.69 at the cut-off, with both CFDs holding well above their 50 and 200-period moving averages on the 4-hour chart.
- Renewed US-Iran hostilities and Houthi threats to Saudi shipping, declared as a “maritime embargo” on 20 July, have disrupted transit through the Strait of Hormuz and the Bab el-Mandeb Strait, two of the world’s most important oil chokepoints.2,3
- OPEC+ is continuing to add supply, agreeing to a further 188,000 barrel-a-day increase for August, even as prices trade well above the US Energy Information Administration’s most recent quarterly forecast.4,5
What the charts are showing
On the 4-hour chart, Brent crude (UKOUSD) opened the session at $88.849, ranged between $88.223 and $88.904, and last traded at $88.571, down 0.31% at the cut-off, according to the Vantage CFD feed. The 50-period moving average sits at 81.914 and the 200-period at 82.961, using the TradingView setup used for this analysis.
Price has held comfortably above both lines since the rally began in early July. The 50-period average has not yet crossed above the 200-period, though the gap between the two has narrowed to less than $1.10. The RSI reads 62.29 against a moving-average overlay of 65.37, indicating positive momentum without yet flagging overbought conditions.

WTI crude (USOUSD) tells a similar story with one extra technical wrinkle. The pair opened at $82.882, ranged between $82.562 and $82.992, and last traded at $82.692, down 0.22%. Here, the 50-period moving average (78.279) has already crossed above the 200-period (78.091), a bullish technical crossover that reflects the strength of the recent recovery, although moving-average signals are inherently lagging. RSI on WTI sits at 60.50 against a 62.76 overlay, a touch cooler than Brent’s reading but pointing the same way.
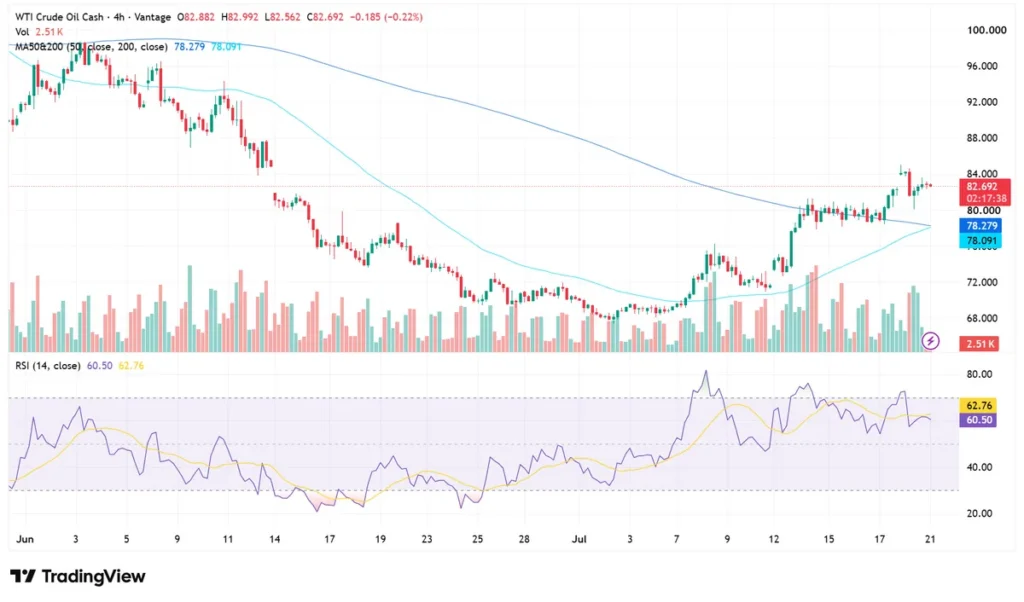
Both charts show the same shape: a prolonged decline through June, a trough spanning late June to early July, followed by a steep, news-driven recovery that has barely paused since.
Why oil keeps grinding higher

The short version: two chokepoints are under pressure at once, and the market is pricing that in. Brent jumped nearly 4% overnight into Monday, briefly breaking above $90, after the US confirmed at least three service members had died in recent fighting with Iran and President Trump said Tehran would face consequences.2 Brent and WTI ultimately settled Monday at $89.22 and $83.23, up 1.3% and 0.9% respectively, as prices eased once Iran’s foreign ministry signalled it remained open to talks with Washington.2
Layered on top is a newer complication. Iran’s Houthi allies in Yemen declared what they called a maritime embargo against Saudi Arabia on 20 July, in retaliation for Saudi strikes on Sanaa and the wider blockade of Yemen.3 Saudi Arabia has been rerouting more than 70% of its crude exports, around 7 million barrels a day, through its East-West pipeline to the Red Sea port of Yanbu since Hormuz became the first flashpoint.8
A serious escalation at Bab el-Mandeb would threaten that relief valve too: Saudi crude loadings through the strait have already dropped 36% over two weeks, to 6.1 million barrels a day from a peak of 9.5 million.6 Markets have so far treated the embargo announcement calmly, with Brent’s reaction described as little changed once the initial overnight spike faded.3
Shipping through Hormuz itself also remains well below pre-conflict norms. Al Jazeera reported only 57 transits over a Friday-to-Sunday window in mid-July, more than a 50% drop from the previous week, as ship owners avoided the waterway during a third consecutive day of US strikes on Iranian targets.7
The other side of the story: supply keeps coming

None of this has slowed OPEC+ down. Seven members of the group, including Saudi Arabia and Russia, agreed on 5 July to raise combined production by 188,000 barrels a day from August, the fifth consecutive monthly increase.5 The move continues a gradual unwinding of the additional voluntary cuts the group introduced in 2023, and it was decided before the latest round of hostilities reignited the risk premium now in the price.
That timing gap matters. The EIA’s most recent Short-Term Energy Outlook, released on 7 July, forecast Brent averaging $74 a barrel in the third quarter of 2026, a $27 cut from the prior month, on the assumption that the mid-June memorandum of understanding would hold.1 That forecast is now over two weeks old, and Brent trades roughly $14 above the EIA’s stated quarterly average, a reminder that supply-side forecasts built around a ceasefire can go stale fast once the ceasefire does not hold.
Brent remains well up on the month even after Monday’s session moved off its intraday high near $91.41, according to Trading Economics data on 20 July, underscoring how far the risk premium has rebuilt since the ceasefire briefly took hold.9
Levels traders are watching
The table below covers reference levels traders are watching across both benchmarks this week. These are reference levels, not trade signals.
| Pair | Support | Resistance | What’s happening |
| UKOUSD (Brent) | 86.00 / 82.00-83.00 (MA cluster) | 90.50 / 92.00 | Trading above both moving averages; 52-week range near $58.72-$126.41 |
| USOUSD (WTI) | 80.00 / 78.00 (MA cluster) | 84.50 / 86.50 | 50-period MA has crossed above the 200-period |
Table 1: Reference levels as of 21 July 2026, based on the 4-hour Vantage CFD chart and the TradingView setup used for this analysis.9 Indicative only, not trade signals.
A few things worth flagging on each pair. Brent’s advance has been the sharper of the two on a percentage basis, consistent with its role as the benchmark for internationally traded, seaborne crude, which tends to price in Middle East and shipping-lane risk more directly than WTI.9 WTI has lagged slightly, but the moving-average crossover there is a supporting technical signal for the recovery, even if lagging indicators should be read alongside price action rather than in isolation.
What to watch this week and beyond
- Strait of Hormuz shipping data, ongoing: UKMTO and MarineTraffic transit counts remain the cleanest real-time signal for how serious the disruption actually is, separate from the headlines.
- Bab el-Mandeb developments, ongoing: whether the Houthi announcement escalates into actual attacks on tankers, as opposed to a symbolic declaration, will matter far more than the announcement itself.
- OPEC+ meeting, 2 August: the group’s next scheduled review of production quotas and compliance.
- US-Iran diplomatic signals, ongoing: Qatar and Pakistan have reportedly been trying to bring Washington and Tehran back toward the terms of the collapsed memorandum of understanding.
- EIA Short-Term Energy Outlook, 11 August: the next scheduled release, and a useful test of how far the agency’s forecast moves once it reflects the past two weeks of escalation.
Volatility in Brent and WTI has been reacting to headlines within minutes rather than hours this month, which makes standard intraday range assumptions less reliable than usual. Traders monitoring positions around the support and resistance levels above may want to revisit how Stop Loss placement is set relative to current volatility, rather than relying on ranges from before the conflict resumed.
Leverage cuts both ways in a market this headline-driven, magnifying gains and losses alike, so position sizing relative to account equity is worth a second look, particularly ahead of the 2 August OPEC+ meeting and any fresh developments around either strait. Learn more about how leverage works before adjusting exposure.
Read these too: Oil CFD trading with Vantage, Brent crude oil trading guide, WTI crude oil trading guide, Oil CFDs explained, What drives oil markets, and the RSI indicator.

RISK WARNING: CFDs are complex financial instruments and carry a high risk of losing money rapidly due to leverage. You should ensure you fully understand the risks involved and carefully consider whether you can afford to take the high risk of losing your money before trading.
Disclaimer: The information is provided for educational purposes only and doesn’t take into account your personal objectives, financial circumstances, or needs. It does not constitute investment advice. We encourage you to seek independent advice if necessary. The information has not been prepared in accordance with legal requirements designed to promote the independence of investment research. No representation or warranty is given as to the accuracy or completeness of any information contained within. This material may contain historical or past performance figures and should not be relied on. Furthermore estimates, forward-looking statements, and forecasts cannot be guaranteed. The information on this site and the products and services offered are not intended for distribution to any person in any country or jurisdiction where such distribution or use would be contrary to local law or regulation.
References
[1] “Short-Term Energy Outlook – U.S. Energy Information Administration” https://www.eia.gov/outlooks/steo/ Accessed on 21 July 2026.
[2] “Oil prices rise after Trump says Iran will pay for killing U.S. service members – CNBC” https://www.cnbc.com/2026/07/20/oil-prices-today-brent-wti-crude-us-iran-centcom-hormuz.html Accessed on 21 July 2026.
[3] “Iran’s Houthi allies declare maritime embargo against Saudi Arabia, escalating threat to oil market – CNBC” https://www.cnbc.com/2026/07/20/iran-houthi-yemen-saudi-arabia.html Accessed on 21 July 2026.
[4] “Short-Term Energy Outlook – U.S. Energy Information Administration” https://www.eia.gov/outlooks/steo/ Accessed on 21 July 2026.
[5] “OPEC+ countries say they will expand monthly oil production – Al Jazeera” https://www.aljazeera.com/economy/2026/7/6/opec-countries-say-they-will-expand-monthly-oil-production Accessed on 21 July 2026.
[6] “Saudi oil loadings drop by 36% as Houthi threats disrupt Bab Al Mandeb passage – The National” https://www.thenationalnews.com/business/energy/2026/07/20/saudi-oil-loadings-drop-by-36-as-houthi-threats-disrupt-bab-al-mandeb-passage/ Accessed on 21 July 2026.
[7] “Oil prices hit 1-month high as US-Iran attacks dim Strait of Hormuz outlook – Al Jazeera” https://www.aljazeera.com/economy/2026/7/14/oil-hits-1-month-high-as-us-iran-fighting-clouds-strait-of-hormuz-outlook Accessed on 21 July 2026.
[8] “Houthis’ Saudi blockade opens a perilous new front, rattling oil markets and global trade – The Week” https://www.theweek.in/news/middle-east/2026/07/21/houthi-saudi-maritime-blockade-red-sea.html Accessed on 21 July 2026.
[9] “Brent crude oil – Price – Chart – Historical Data – News – Trading Economics” https://tradingeconomics.com/commodity/brent-crude-oil Accessed on 21 July 2026.
