Brent Crude Oil Holds Near $95 as OPEC+ Hike Meets Hormuz Uncertainty
Vantage Editorial Team >
Vantage Editorial Team >
Vantage is a global, multi-asset broker with a team of in-house writers and market analysts who produce educational and insightful trading content for traders of all levels.
Brent crude oil prices are sitting near $95.28 (UKOUSD) and WTI crude oil prices near $91.75 (USOUSD) as of 09 June 2026, 01:50 UTC, on the Vantage CFD feed. Both instruments have pulled back from their April peak above $120 after a fragile ceasefire eased the near-term risk premium, yet neither has returned to the sub-$72 levels seen before the conflict started in late February 2026.
Three things are moving crude oil prices this week: a fourth straight OPEC+ quota hike approved on 7 June 2026, fresh Iran-Israel missile exchanges on 8 June 2026, and the EIA Short-Term Energy Outlook (STEO) due on 9 June 2026. All three point in different directions, which is why Brent has been range-bound rather than trending cleanly.
All price references in this oil price chart analysis are as of 09 June 2026, 01:50 UTC (09:50 GMT+8). This is not financial advice.
Key Points
- Brent crude oil price (UKOUSD): $95.28 and WTI (USOUSD): $91.75 as of 09 June 2026, 01:50 UTC. Both benchmarks sit below their 200-day moving averages, which are acting as resistance at $103.97 (Brent) and $98.61 (WTI).
- OPEC+ July quota hike: Seven members approved a 188,000 bpd increase on 7 June 2026, the fourth consecutive monthly hike. Analysts describe the rise as largely symbolic while the Strait of Hormuz remains severely disrupted.[1]
- RSI readings: 40.78 on UKOUSD and 43.13 on USOUSD on the TradingView setup used for this analysis. Both sit below the 50 midline, consistent with the post-spike consolidation seen across both charts.
What the oil price charts show
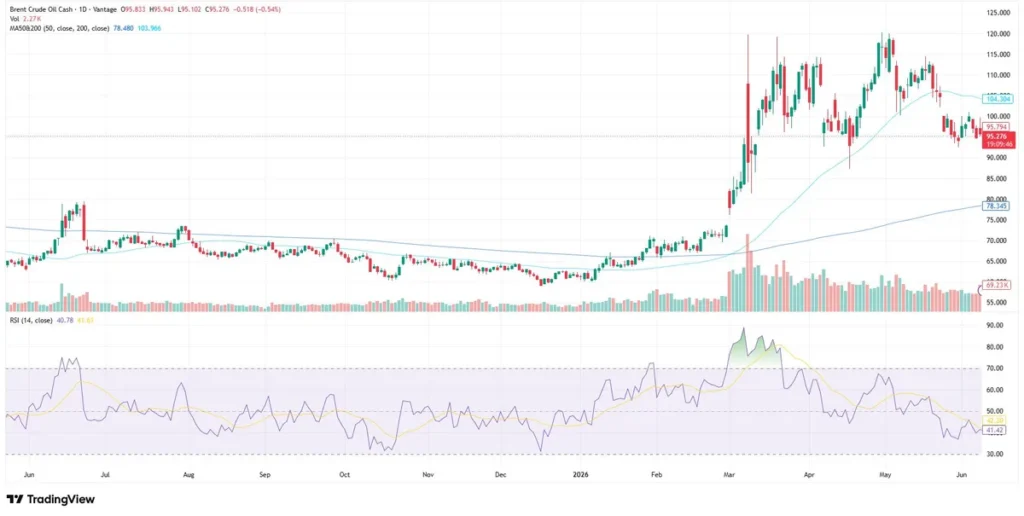
UKOUSD: Brent crude oil daily chart
Brent crude spiked above $120 in end April 2026 after joint US-Israeli strikes disrupted Middle East energy infrastructure and pushed the Strait of Hormuz into what the EIA’s May STEO described as effectively closed, severely constraining regional exports.[2] The 200-day MA, currently at $103.97, has repeatedly acted as resistance since the post-spike retreat. Price has been compressing between roughly $90 and $100 for several weeks.
The 50-day MA at $78.48 sits well below current price, reflecting the scale of the original spike. The RSI (14) on the TradingView setup used for this analysis reads 40.78 with a signal line at 41.61, below the midline, consistent with subdued momentum rather than a fresh recovery.
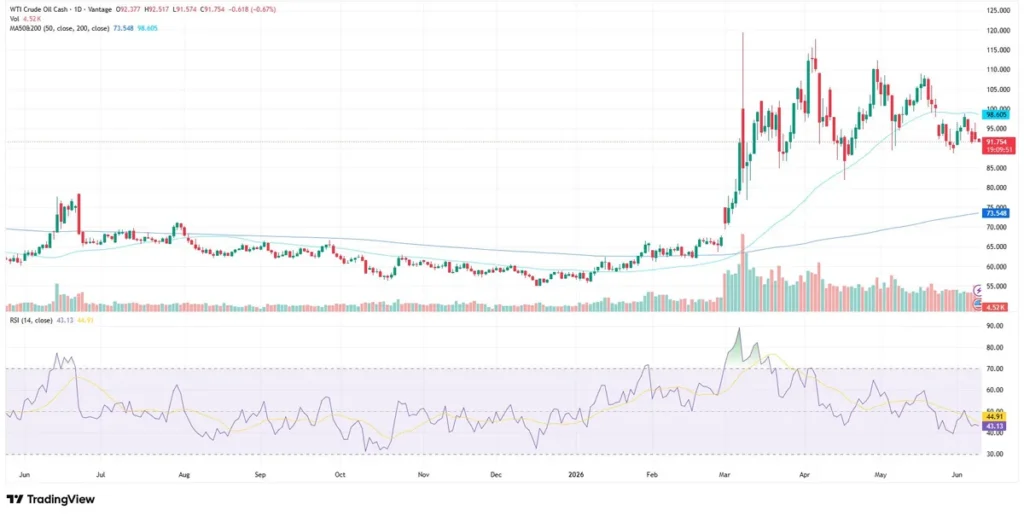
USOUSD: WTI crude oil daily chart
WTI crude oil mirrored the Brent move, rallying from roughly $63 in late February to near $120 in April before retreating. The 200-day MA at $98.61 has capped price on the daily chart. The Brent-WTI spread has held consistent with historical norms at roughly $3 to $4 per barrel.
The 50-day MA at $73.55 is a structural artefact of the pre-conflict pricing environment. RSI (14) on the TradingView setup reads 43.13 (signal line: 44.91). Volume on the Vantage CFD feed has been elevated versus the 2025 baseline but has declined gradually from the spike peak.
Three forces behind crude oil prices this week
1. The Hormuz supply shock: inventories declining, draw pace accelerating
The severe disruption to Strait of Hormuz traffic since late February 2026. According to the EIA’s May STEO, Iraq, Saudi Arabia, Kuwait, the UAE, Qatar, and Bahrain collectively shut in roughly 10.5 million bpd of crude oil production in April 2026.[2] US commercial crude oil stocks fell 8.0 million barrels to 433.7 million barrels in the week ending 29 May 2026, approximately 3% below the five-year seasonal average.[3]
Combined with SPR drawdowns, the EIA’s May STEO projected global oil inventories would fall by an average of 8.5 million b/d in the second quarter of 2026, particularly in May and June, as production shut-ins outpace supply from non-disrupted sources.[4] Even if Hormuz traffic picks up through June as the EIA anticipates, flows are not expected to return to pre-conflict levels until later in 2026.[5]
2. OPEC+ July hike: 188,000 bpd on paper, very little in practice
Seven OPEC+ members approved a 188,000 bpd increase in July crude oil production quotas on 7 June 2026, the fourth consecutive monthly hike and part of the gradual unwinding of the 1.65 million bpd cut agreed in 2023.[1] Actual production averaged 33.19 million bpd in April, down from 42.77 million bpd in February, as Gulf exporters remain unable to ship freely.
Jorge Leon of Rystad Energy, a former OPEC official, was cited by CNBC saying the hike adds very few barrels while Hormuz remains disrupted, and flagged a possible rapid shift from supply shortage to surplus once the waterway reopens.[1] From July, the seven core members have about 567,000 bpd of the original cut left to return to market if monthly hikes of 188,000 bpd continue through September, per Reuters calculations.[6]
3. Iran-Israel missile strikes: ceasefire progress then escalation
Iran and Israel exchanged missile strikes on 8 June 2026, briefly pushing Brent crude oil prices above $98 before easing back to around $94 after Iran stated it had ended its operations and Trump indicated progress on a proposed 60-day ceasefire.[7] Trump also called on both sides to halt further military action.
This spike-and-retreat pattern has repeated multiple times since February. The net result is that Brent crude oil prices remain roughly $23 per barrel above pre-conflict levels despite the partial pullback from the April peak. OPEC figures cited at the June 2026 Vienna meeting also noted that China had been drawing on existing stocks rather than increasing overseas crude purchases since the conflict began, limiting the demand-side pressure on prices from Asia’s largest consumer.[7]
Key crude oil price levels to watch
The table below covers the zones market participants are monitoring on UKOUSD and USOUSD CFDs. These are reference levels, not trade signals. All data as of 09 June 2026, 01:50 UTC.
| Instrument | Support 1 | Support 2 | Resistance | Chart Context |
| UKOUSD (Brent) | $88.00 | $83.00 | $103.97 (200-day MA) | Price below 200-day MA; 50-day MA at $78.48 far below current price |
| USOUSD (WTI) | $85.00 | $80.00 | $98.61 (200-day MA) | Price below 200-day MA; 50-day MA at $73.55 far below current price |
Table 1: UKOUSD and USOUSD key levels as of 09 June 2026. Sources: TradingView, Vantage CFD feed. Indicative only.
Oil news today: what to watch this week
| Event | Date | Relevance for Oil Prices |
| EIA Weekly Petroleum Status Report | 10 June 2026 | Next read on US crude stocks; commercial inventories at 433.7M barrels, 3% below the five-year average |
| EIA Short-Term Energy Outlook (STEO) | 9 June 2026 | Updated Brent crude oil price forecasts and supply disruption estimates from the primary US energy data authority |
| OPEC Monthly Oil Market Report | Week of 9 June 2026 | May 2026 production data and demand outlook; context for the July 188,000 bpd quota hike |
| US CPI (May 2026) | 11 June 2026 | Inflation print feeds Fed rate expectations, which affect the US dollar and oil demand outlook |
| Middle East ceasefire / Hormuz developments | Ongoing | Any shift in the conflict status has moved oil prices sharply in both directions since February 2026 |
Table 2: Key events for oil prices, week of 9 June 2026. Sources: EIA, OPEC, Reuters. Indicative only.
Stop loss and exposure considerations
Market participants often monitor key structural zones when assessing risk during periods of elevated volatility. In UKOUSD and USOUSD, headline-driven price gaps have moved beyond normal daily ranges on multiple occasions since the conflict began. Stop Loss orders and the levels market participants track are reference points for gauging how the chart story is developing. The 200-day MA overhead ($103.97 on Brent, $98.61 on WTI) and the $88-$90 area below current Brent price are among the zones that appear on daily charts for both instruments.
Leverage and position sizing
Crude oil CFDs are accessible with leverage, which amplifies both potential gains and potential losses equally. With UKOUSD and USOUSD moving sharply on Hormuz and ceasefire headlines, position sizing relative to account equity is worth reviewing before the EIA STEO release on 9 June 2026 and ahead of the US CPI print on 11 June 2026. Market participants holding correlated positions across both crude benchmarks should factor combined exposure into their risk assessment.
RISK WARNING: CFDs are complex financial instruments and carry a high risk of losing money rapidly due to leverage. You should ensure you fully understand the risks involved and carefully consider whether you can afford to take the high risk of losing your money before trading.
Disclaimer: The information is provided for educational purposes only and doesn’t take into account your personal objectives, financial circumstances, or needs. It does not constitute investment advice. We encourage you to seek independent advice if necessary. The information has not been prepared in accordance with legal requirements designed to promote the independence of investment research. No representation or warranty is given as to the accuracy or completeness of any information contained within. This material may contain historical or past performance figures and should not be relied on. Furthermore estimates, forward-looking statements, and forecasts cannot be guaranteed. The information on this site and the products and services offered are not intended for distribution to any person in any country or jurisdiction where such distribution or use would be contrary to local law or regulation.
References
[1] “OPEC+ approves fourth oil output quota hike since Hormuz closure – CNBC” https://www.cnbc.com/2026/06/07/opec-set-for-fourth-oil-quota-hike-since-strait-of-hormuz-closure.html Accessed on 09 June 2026.
[2] “Short-Term Energy Outlook May 2026 – U.S. Energy Information Administration” https://www.eia.gov/outlooks/steo/ Accessed on 09 June 2026.
[3] “EIA Weekly Petroleum Status Report, week ending 29 May 2026 – U.S. Energy Information Administration” https://www.eia.gov/petroleum/supply/weekly/ Accessed on 09 June 2026.
[4] “EIA updates forecast amid continued Mideast disruption (Press Release) – U.S. Energy Information Administration” https://www.eia.gov/pressroom/releases/press588.php Accessed on 09 June 2026.
[5] “OPEC agrees fourth monthly output rise despite Hormuz closure and price swings – The National” https://www.thenationalnews.com/business/energy/2026/06/07/opec-agrees-fourth-monthly-output-rise-despite-hormuz-closure-and-price-swings/ Accessed on 09 June 2026.
[6] “OPEC+ set for fourth increase in oil output targets since Hormuz closure – Business Standard / Reuters” https://www.business-standard.com/amp/world-news/opec-set-for-fourth-increase-in-oil-output-targets-since-hormuz-closure-126060700225_1.html Accessed on 09 June 2026.
[7] “Brent crude oil price news and data – Trading Economics” https://tradingeconomics.com/commodity/brent-crude-oil Accessed on 09 June 2026.
