Markets Reprice Risk After Sharp Sell-Offs and Rebounds (Feb 9–13, 2026)

John Ikechukwu >
John Ikechukwu >
Vantage is a global, multi-asset broker with a team of in-house writers and market analysts who produce educational and insightful trading content for traders of all levels.

Market Overview
Global markets begin the second week of February still digesting the implications of recent sell-offs and rebounds. After Bitcoin plunged to its weakest levels since late 2024 before rallying back above $70,000, risk sentiment remains fragile, according to Reuters. Equities have been mixed — the Nasdaq 100 has fluctuated, while broad U.S. indexes showed a late-week rebound led by industrials and value names, according to AP News
Gold, having corrected sharply from recent highs, now trades in a lower range as investors reassess safe-haven exposure, investing.com. Oil prices have been buoyed by supply concerns but face demand uncertainty. The dollar, which softened last week, may remain sensitive to U.S. data and policy expectations. This context may continue shaping risk allocation decisions through the new trading week, where macro prints — including inflation, jobs reports, and central bank communication — may act as catalysts for renewed directional moves.
EURUSD
Fundamental Context:
The euro has shown resilience against the U.S. dollar, buoyed partly by broader currency flows. However, macro divergence between the Eurozone and U.S. economic performance may continue to impact the pair.
Current Price Reference:
EURUSD recently traded near 1.20 before corrective moves, Investing.com.
Technical Perspective (Support / Resistance):
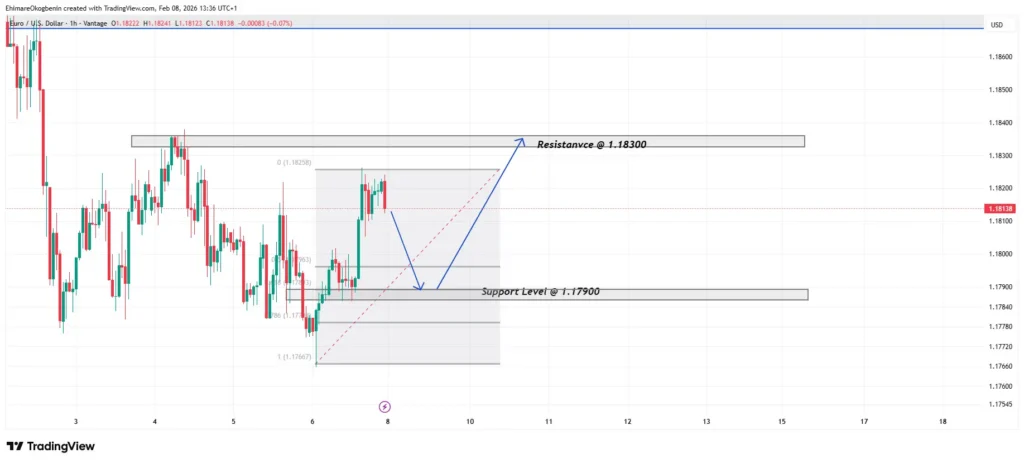
- Resistance: 1.18300
- Support: 1.17900
Outlook:
EURUSD has recently traded in a defined range. Levels around 1.2100 and 1.1850 are often observed in technical analysis to study historical price behavior.
GOLD (XAUUSD)
Fundamental Context:
Gold’s sharp correction from multiyear highs reflects profit-taking and a shift in risk sentiment. However, safe-haven demand could return if macro uncertainty rises.
Current Price Reference:
Gold recently traded near $4,865 per ounce, down significantly from earlier peaks. (Investing.com Nigeria)
Technical Perspective:
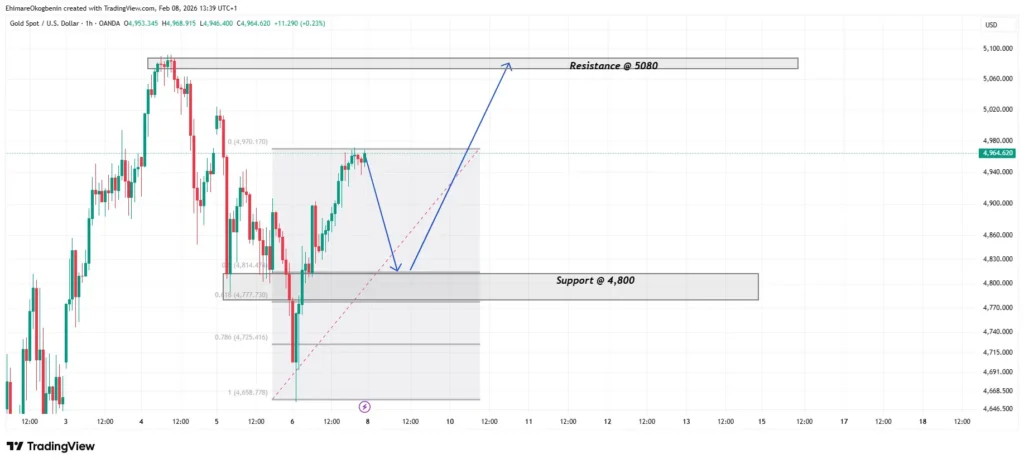
- Resistance: $5,080 | Next: $5,150
- Support: $4,800 | Next: $4,600
Outlook:
Gold prices have recently fluctuated between $4,600 and $4,800. Analysts often reference these levels to examine past market behavior.
BTCUSD (Bitcoin)
Fundamental Context:
Bitcoin has been one of the most volatile assets recently, falling as low as $60,000 before rebounding above $70,000, Reuters reported. Ongoing risk sentiment, macro data, and crypto market positioning may continue to influence price behaviour.
Current Price Reference:
Bitcoin is trading around $70,000. (Reuters)
Technical Perspective:
- Resistance: $75,000 | Next: $80,000
- Support: $65,000 | Next: $60,000
Outlook:
Bitcoin has experienced recent volatility, moving between $60,000 and $75,000. These ranges are commonly studied to understand historical market behavior.
NASDAQ 100 (NAS100)
Fundamental Context:
The tech-heavy Nasdaq has been volatile, reflecting shifting investor preference between growth and value, earnings outcomes, and broader risk sentiment.
Current Price Reference:
Nasdaq 100 is trading near 25,000–25,100. (Investing.com Nigeria)
Technical Perspective:

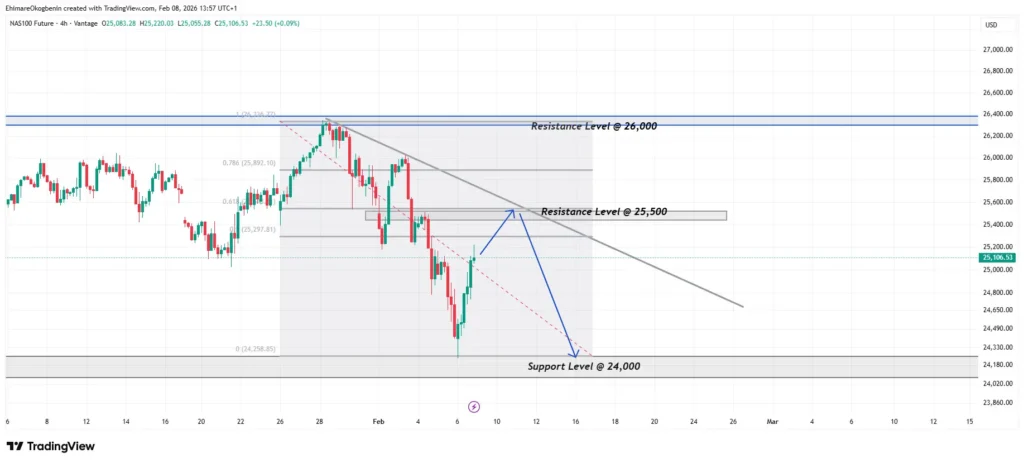
- Resistance: 25,500 | Next: 26,000
- Support: 24,000
Outlook:
The Nasdaq 100 has recently traded between 24,000 and 25,500. Observing these levels helps analysts understand historical market trends.
WTI Crude Oil (USOIL)
Fundamental Context:
Oil prices continue to reflect supply dynamics and geopolitical tensions. While demand data remains mixed, oil may find interest around key technical zones.
Current Price Reference:
WTI crude is near $60–$64 per barrel, according to Investing.com
Technical Perspective:
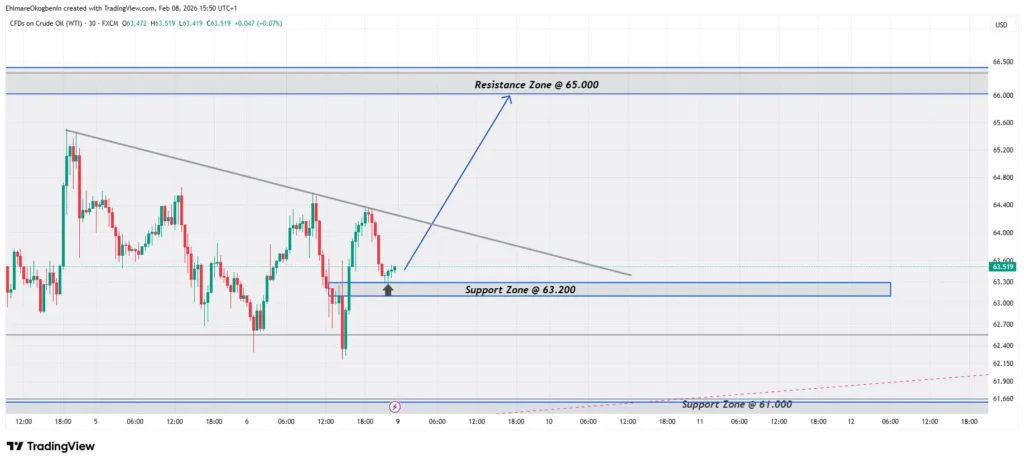
- Resistance: $65.00
- Support: $63.200 | Next: $61.000
Outlook:
WTI crude oil prices have recently been between $61 and $65 per barrel. Traders often reference these levels for educational analysis of past price behavior.
U.S. Dollar Index (DXY)
Fundamental Context:
The U.S. dollar has softened after recent downtrends but may regain footing if risk appetite falters or U.S. data surprises to the upside.
Current Price Reference:
DXY is trading around 97–98. (Investing.com)
Technical Perspective:
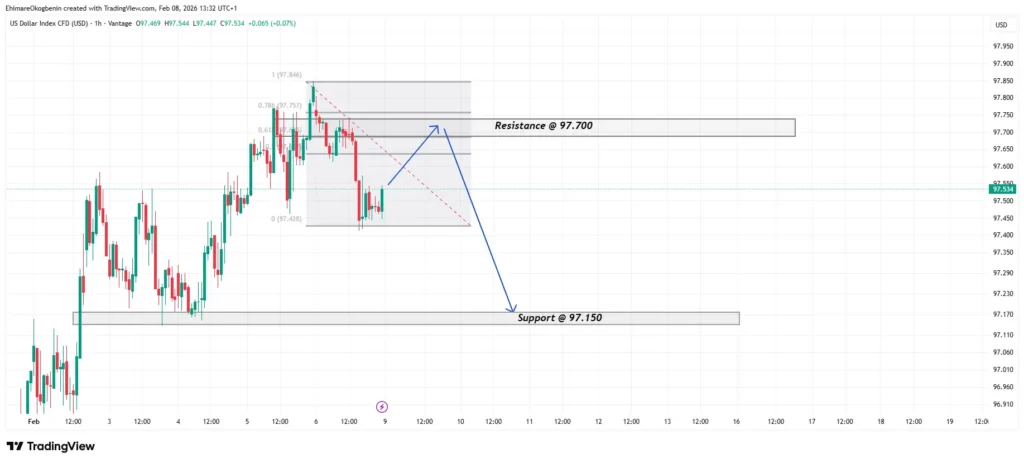
- Resistance: 97.700
- Support: 97.150
Outlook:
DXY might remain anchored in a broad range. The U.S. Dollar Index has been trading between 97.150 and 97.700. These ranges are sometimes studied to analyze historical market behavior.
NVIDIA (NVDA)
Fundamental Context:
NVIDIA’s stock price reflects broader sentiment in the AI and semiconductor complex. Recent rebounds in tech shares may support Nvidia, but sector sentiment remains fickle.
Current Price Reference:
NVDA is trading around $185–$192 per share. (Yahoo Finance)
Technical Perspective:

- Resistance: ~$195 | Next: ~$210
- Support: $180 | Next: $175
Outlook:
NVDA has recently traded between $175 and $210. Analysts often observe these ranges to understand historical price behavior.
Summary
Entering February 9–13, markets may oscillate between recovery and caution as risk sentiment continues to recalibrate after recent volatility.
- If macro data and earnings reaffirm confidence, risk assets like tech equities, Bitcoin, and oil may find renewed momentum.
- However, elevated uncertainty — especially in crypto and precious metals — could reinforce defensive positioning in gold and the U.S. dollar.
Market participants may benefit from monitoring key technical levels alongside evolving economic and geopolitical data.
Risk Warning & Disclaimer
RISK WARNING:
CFDs and leveraged products are complex financial instruments that carry a high risk of losing money rapidly. You should ensure you fully understand the risks and carefully consider whether you can afford to take the high risk of losing your money before trading.
DISCLAIMER:
This information is provided for educational and informational purposes only and does not constitute investment advice or a recommendation to buy or sell any financial instrument. It reflects the general market perspective at the time of writing and does not consider individual objectives, financial situations, or risk tolerance. Market conditions change rapidly, and past performance is not a reliable indicator of future results. You should seek independent financial advice where appropriate.
