
 Updated
NASDAQ markets can move fast and react sharply to new information. That speed attracts active traders, but it also punishes weak plans. Trading signals help you spot setups with clear rules and clear risk. They do not predict the future. They help you act with structure.
This guide explains in detail all that you need to know about NASDAQ trading signals in a practical way. It is for learning, not personal investment advice.
What is NASDAQ, and what are trading signals?
Before I go into detail on the NASDAQ trading signal, I would like to briefly discuss the NASDAQ (National Association of Securities Dealers Automated Quotations) Stock Market. NASDAQ is the second-largest by market cap among American Stock Exchanges and the first fully electronic stock market. The exchange platform is based in Manhattan, New York City, and the platform is owned by NASDAQ Inc.
The platform made trading faster and more transparent. Aside from that, it also set the stage for subsequent technological advances in the finance market. Nowadays, it is home to many technology companies, including Apple and Microsoft, as well as over 5,000 other companies.
Talking of the NASDAQ Stock Exchange, it is the largest stock exchange in the United States of America and the third-largest worldwide, after the Japan Exchange Group and TMX in Canada.
A trading signal is a rule-based clue for a possible trade. It tells investors when to look, not what will surely happen.
Trading signals usually come from price, volume, historical data, and market behaviour. Some signals aim to catch trends. Others target quick reversals. Your job is to choose signals that fit your style and time.
Nasdaq vs Nasdaq 100 vs US100
NASDAQ: It is the Nasdaq Composite, an index of stocks publicly traded on Nasdaq. It is a heavyweight among many technology companies, including Facebook, Tesla, Apple, and Google.
NASDAQ 100: It is a stock market index, not an exchange, comprising equity securities. It tracks about 100 of the largest non-financial companies listed on the Nasdaq Stock Exchange.
US 100: A product offered by brokers that tracks the Nasdaq 100 index. It is a derivative and does not give direct ownership of the underlying stocks. It is often used to observe or speculate on the technology sector performance.
| Feature | Nasdaq | Nasdaq 100 | US100 |
| What it is | A stock exchange | Stock market index | A broker symbol or trading name |
| Main meaning | A marketplace where stocks are listed and traded | An index of about 100 large non-financial companies listed on Nasdaq | It is a product that usually tracks the Nasdaq 100 |
| Official or broker term | It is an official | Represents an official | Usually broker-created |
| Includes | Many listed companies on the Nasdaq exchange | Large non-financial Nasdaq-listed companies | Depends on the broker |
| Focus | Broad market venue | Large-cap growth and tech-heavy firms | Trading access to the Nasdaq 100 price moves |
| Is it an exchange? | Yes | No | No |
| Is it tradable directly? | Can’t be traded directly | Not directly | Yes, through a broker |
| Common use | Refers to the exchange or sometimes the Nasdaq Composite | Used for market tracking, ETFs, and analysis | Used for CFDs or similar trading products |
| Sector weight | Broad | Strong tech focus | Follows the Nasdaq 100 movement in most cases |
| Price behaviour | Well-established and observable | Fairly consistent | Sharp and less predictable |
| Financial companies included? | Yes. On the Exchange | Mostly no | Based on the Nasdaq 100 product |

Types of Nasdaq Trading Signals
There are several types of trading signals available to cater to different trading preferences. Each signal type has a best market condition. When you match the signal to the market, results improve fast. Below are the different types of signals;
1) Trend signals
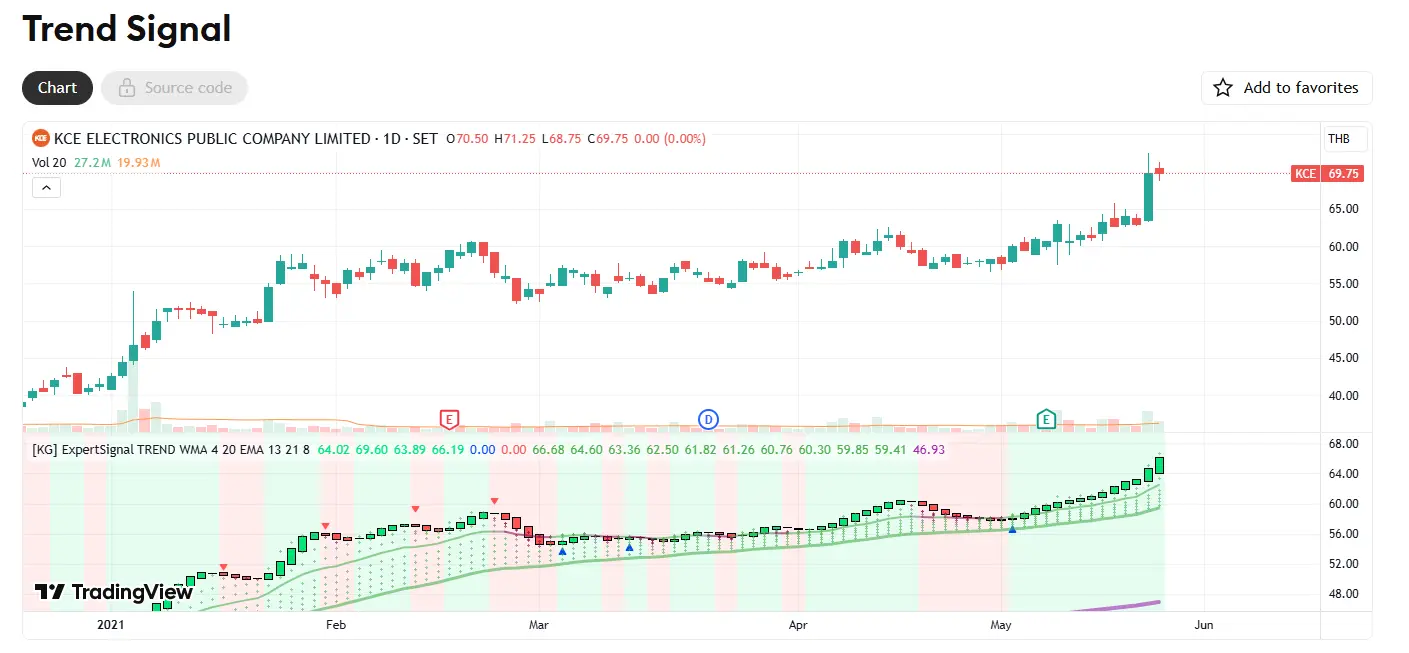
Trend trading strategy capitalises on an asset’s directional momentum without predicting precise peaks and valleys. Trend signals aim to identify the market’s main path and suggest points where traders might consider buying or selling, based on historical patterns. They assume that strength may last for a while, but outcomes are not guaranteed.
Tools people use:
- Moving averages and crossovers
- Trendlines, channels, and swing structure
- Higher highs / higher lows or the reverse
2) Momentum signals
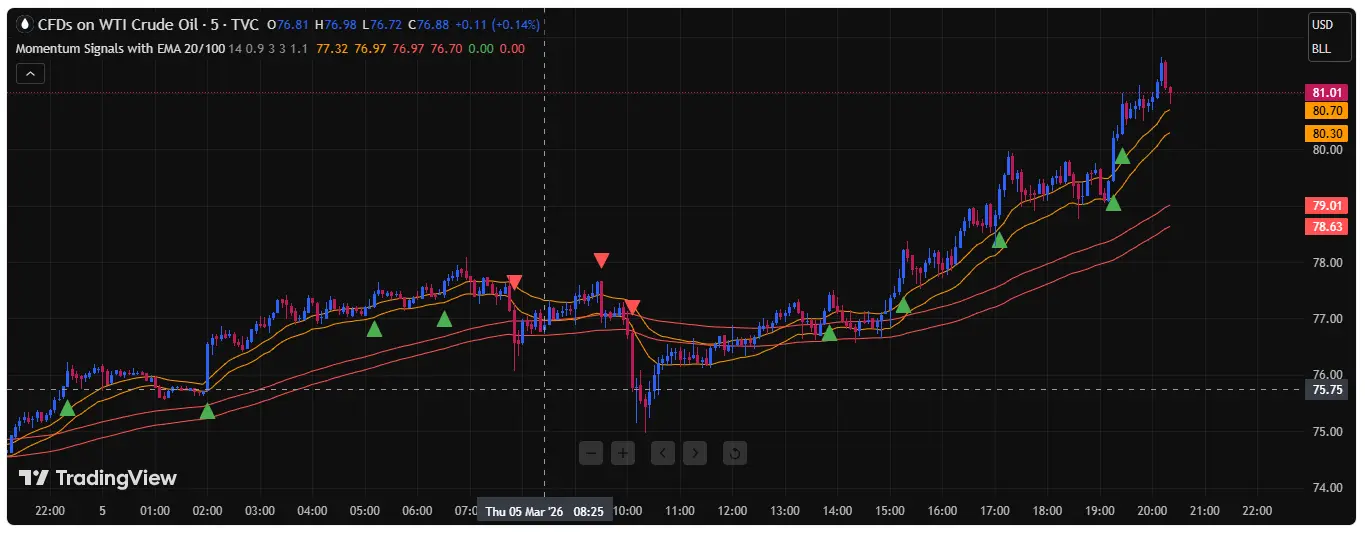
Momentum signals are technical indicators that measure the strength and velocity of price movements. They can be used to assist with timing and identifying potential shifts, but they do not guarantee outcomes.
Tools people use:
- Relative Strength Index (RSI), Moving Average Convergence Divergence (MACD), Rate of Change (ROC)
- Candle strength and impulse moves
- Volume bursts (when volume data is reliable)
3) Breakout signals
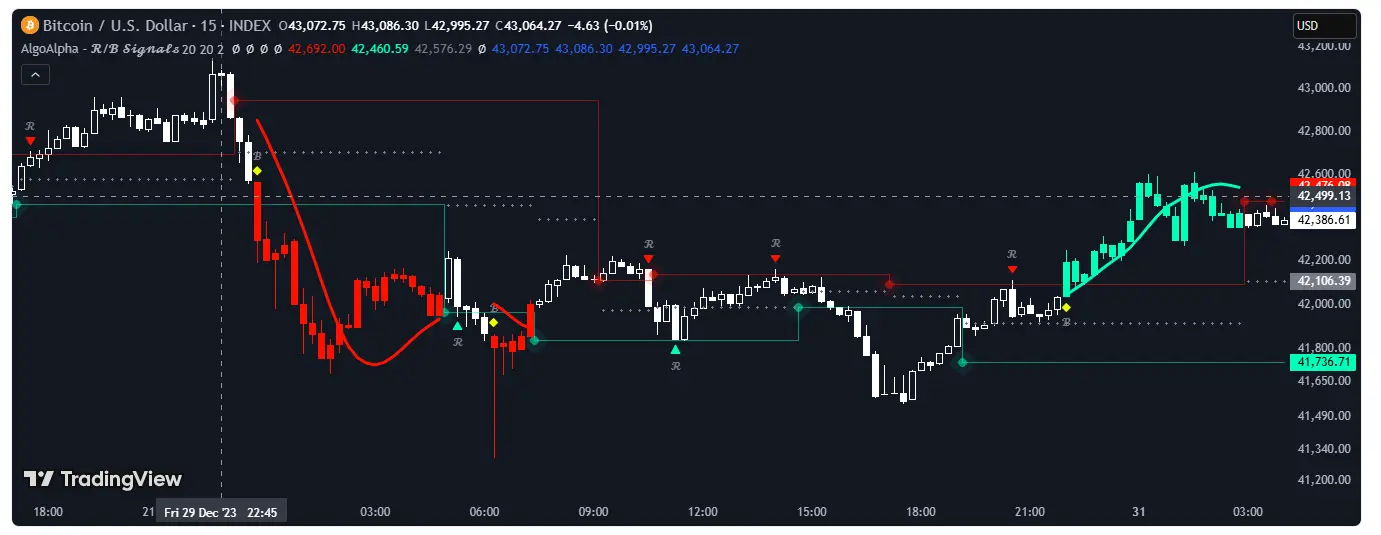
Breakout signals look for the price to move beyond a defined support or resistance level, signalling the potential start of a strong price trend. That boundary can be a range top, a big swing high, or a chart pattern edge.
Tools people use:
- Close above resistance or below support
- Range breaks after long consolidation
- Volatility squeezes
4) Mean reversion signals
Mean-reversion signals show when an asset price has deviated significantly from its average, suggesting a likely return to that mean. Expect the price to drift back toward a typical range. They work best when markets move sideways and respect ranges.
Tools people use:
- Bollinger Bands and band tags.
- RSI extremes in a range
- Distance from a moving average or VWAP
5) News-driven signals
They are intelligence indicators that are derived from the media, public announcements, policy decisions, and data releases. News-driven signals respond to new information that quickly shifts price.
Common drivers:
- Inflation and jobs data
- Central bank rate calls and guidance
- Earnings and outlook updates
- Major political or risk events
How to Read a Signal
Reading a signal is not just about buying or selling. A good signal is a small plan with clear rules. If those rules are missing, it is not a real signal.
1) Entry idea
The entry idea explains what you are trying to trade. It should answer three simple questions:
A. Direction
- Are you looking to buy or sell
- Are you trading with the trend or against it?
B. Trigger: This is the exact event that starts the trade. Examples:
- Buy after a close above resistance.
- Sell if the price breaks support and retests it.
- Buy when momentum turns up after a pullback.
C. Location: Where you enter matters as much as the signal itself. A strong entry usually has:
- A clear level (support, resistance, trendline, prior high/low)
- A reason the level should hold or break
- Enough “space” to the next key level
2) Invalidation
Invalidation is not based on feelings, but it tells you: “This idea failed.” It is based on structure. A clear invalidation usually sits:
- Below is a recent swing low for a buy
- Above a recent swing high for a sell
- Back inside the range for a breakout trade
Examples:
- Trend trade: If the price breaks below the last higher low, the trend is weak.
- Breakout trade: “If price returns into the old range and holds there, exit.
- Mean reversion: If the price keeps pushing beyond the band and breaks the structure, exit.
3) Timeframe
Every signal has a home timeframe. That timeframe shapes how long the trade may take.
Typical uses:
- Higher timeframe (HTF): sets direction and key levels (daily, 4H, weekly)
- Entry timeframe: gives the trigger and timing (1H, 15m, 5m)
If you mix timeframes without a rule, you end up with confusion.
Example:
- Daily trend is up, but you’re short on a 5-minute signal. That can work, but it is a different strategy.
4) Risk
Risk is what makes a signal tradable. Without risk rules, a good signal can still ruin you. A complete risk plan includes:
A. Stop-loss (based on invalidation)
Your stop should be set to the invalidation level. Not too tight, not too wide.
B. Position size
You adjust the size so each trade risks the same amount. Example idea:
- Risk 1% per trade.
- If the stop is wider, the size is smaller.
C. Target and reward-to-risk
Set a target based on structure, not hope. Common target choices:
- Next support/resistance zone
- Prior swing high/low
- Measured move from a range
Paper test the signal
Paper trading is trading with fake money. It allows day traders and other individuals, such as new or novice investors, to learn the basics of buying and selling stocks without risking real money.
It helps you confirm a few things;
1) The rules are clear
You should know the exact trigger for entry and exit. If you “guess,” you are not testing a signal.
2) The signal is tradable in real time
Some signals look easy in hindsight. Live charts feel very different.
3) Your broker conditions do not break the idea
Spreads can widen during news and quiet hours. Slippage can affect your entry and stop price.
Backtest
Backtesting applies your rules to historical data, which is crucial for traders to evaluate a strategy’s potential effectiveness. A strong backtest is not only about profit. It must include risk, drawdowns, and real trading costs.
WhatsApp signals and how they work
Some WhatsApp signals are shared as trade ideas, but they are examples, not recommendations. They may be delayed, incomplete, or biased. They are common in Forex, indices like the US100. These trade ideas typically include currency pairs, entry prices, stop-loss, and take-profit levels.
Risks of WhatsApp signals
- It shows no proof of long-term results. Many providers post only winners; losses get deleted or ignored.
- Signals often arrive late, so you enter after the move has already happened.
- There is a hidden conflict of interest: some signal sellers earn commissions from broker referrals.
- It is prone to scams and account theft.
- Many signals focus on entry only
Nasdaq 100 Trading Hours and Timing
Trading the Nasdaq 100 depends on what you trade. The index is a benchmark, not a tradable product. You trade it through ETFs, futures, or broker symbols like US100. The NASDAQ is open for 6.5 hours per day.
These are the windows most traders focus on.
1) The first 60–120 minutes after the US open
This is the most active part of the day. Liquidity is high, and levels can experience significant price movement or consolidation.
In SAST:
- 15:30–17:30 (US DST)
- 16:30–18:30 (US standard time)
2) The last hour before the US closes
You often see strong closing flows and sharp moves. It is also when daily charts lock in their close.
In SAST:
- 21:00–22:00 (US DST)
- 22:00–23:00 (US standard time)
3) Major US data releases
Many market-moving releases hit at 8:30 am ET. That is 14:30 SAST in US DST, or 15:30 SAST in US standard time. These minutes can be fast and messy, so plan entries.
Frequently Asked Questions
What are Nasdaq trading signals?
Nasdaq trading signals are trade setups associated with Nasdaq-traded markets. They usually show direction, entry zone, stop level, and targets.
What’s the difference between Nasdaq and Nasdaq 100 (US100)?
Nasdaq is the exchange where many shares are listed and traded. Nasdaq 100 is a focused index of large non-financial Nasdaq firms, while US100 is often a broker label for a product that tracks the Nasdaq 100.
Do Nasdaq 100 trading signals work?
They can work when the rules fit current market conditions, and risk is controlled. Results often differ because volatility, costs, and timing can change quickly.
What is a good trading signal?
A strong signal is specific and rule-based, not vague. It includes a clear trigger, a clear “wrong point,” and a realistic target based on structure.
How do you test a trading signal?
First, paper trade to confirm you can follow the rules in live markets. Next, backtest it over different market phases and include spreads, slippage, and drawdowns.
Are free Nasdaq signals reliable?
Free signals can be useful as examples, but many are not tracked properly. Use them as starting points, then validate them with your own testing.
Why are ‘Nasdaq signals today’ risky?
They often encourage rushed trades and emotional decisions. Intraday headlines, fast swings, and spread widening can turn a good idea into a bad entry.
Is it safe to use a Nasdaq signals app or APK file?
Apps from trusted stores are generally safer than files shared in chats or on websites. Avoid downloading random APKs because they can contain malicious code and data-stealing tools.
Are WhatsApp trading signals legit?
Many WhatsApp signals are shared for educational or marketing purposes, but some may be biased, incomplete, or intended to sell subscriptions. They should not be considered reliable for live trading, and outcomes are never guaranteed. Always rely on verified, rule-based strategies and paper or backtesting before risking real money.
RISK WARNING: CFDs are complex financial instruments and carry a high risk of rapid loss of money due to leverage. You should ensure you fully understand the risks involved and carefully consider whether you can afford to take the high risk of losing your money before trading.
Disclaimer: The information is provided for educational purposes only and doesn’t take into account your personal objectives, financial circumstances, or needs. It does not constitute investment advice. We encourage you to seek independent advice if necessary. The information has not been prepared in accordance with legal requirements designed to promote the independence of investment research. No representation or warranty is given as to the accuracy or completeness of any information contained within.
This material may contain historical or past performance figures and should not be relied on. Furthermore, estimates, forward-looking statements, and forecasts cannot be guaranteed. The information on this site and the products and services offered are not intended for distribution to any person in any country or jurisdiction where such distribution or use would be contrary to local law or regulation.
References
- https://www.investopedia.com/terms/n/nasdaq.asp What is the NASDAQ?
- https://en.wikipedia.org/wiki/Nasdaq#:~:text=Nasdaq+Stock+Market+(National+Association,first+fully+electronic+stock+market. NASDAQ Stock Market
- https://en.wikipedia.org/wiki/Nasdaq-100 What is the NASDAQ 100
- https://www.investopedia.com/investing/momentum-and-relative-strength-index/ Understanding Momentum Indicators
- https://www.investopedia.com/articles/trading/05/030205.asp Backtesting Trading Strategies
- https://www.statista.com/topics/10014/nasdaq-stock-market/#topicOverview NASDAQ Stock Market Statistics and Facts