
 Updated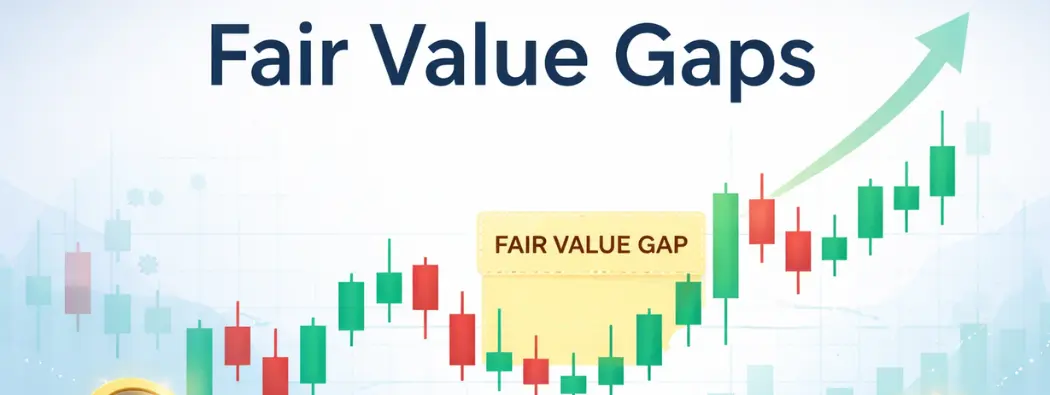
In foreign exchange trading, Fair value gaps trading can appear confusing at first glance. Many traders see them as “empty space” on a chart. Others call them “imbalance” left after a fast move.
Fair Value Gaps is a concept discussed in some trading communities, including ICT traders, to identify and interpret areas where prices moved rapidly. This framework is for educational purposes only.
In this write-up, you will learn in minute detail what fair value gaps are, why they form, why fvg matter, how to identify fair value gaps in a chart, the common fair value gap mistakes, and how to fix them.
What is Fair Value Gaps?
A fair value gap (FVG) is a pattern on a candlestick chart that indicates a price area that was skipped during a rapid price move. Some traders interpret a rapid price move as leaving an imbalance on the chart, where little trading occurred. Retail traders cannot verify which participants caused the move.
Illustration:
Imagine a dispatch bike rider racing through traffic to meet a tight deadline.
He rides past several drop-off points without stopping. Later, he circles back to complete those missed drop-offs.
In this analogy, the circle-back is similar to how price sometimes revisits areas on a chart that moved quickly, leaving what traders call an imbalance. This example is illustrative only and does not imply any market prediction or trading opportunity.
In many charting lessons, FVG and imbalance are used interchangeably. In the current market environment, FVGs matter for many reasons, some of which are:
- Some traders use Fair Value Gaps to observe how the price may behave if it revisits certain areas. There is no guarantee of any particular outcome.
- They help address price imbalances and liquidity by identifying areas of rapid price movement with limited trading.
- Some traders describe rapid price moves as leaving a ‘footprint,’ sometimes called ‘Smart Money activity.’ These are interpretations only, and retail traders cannot confirm the actual market participants or predict future price moves.
- Some traders may observe these areas as potential points of interest on a chart, but there is no guarantee of reduced risk.
- Planning is important for any chart analysis. FVGs can be used as part of a chart study to help traders form their own observations, without implying predictive accuracy.
The 3-Candle Fair Value Gaps Idea Most People Use
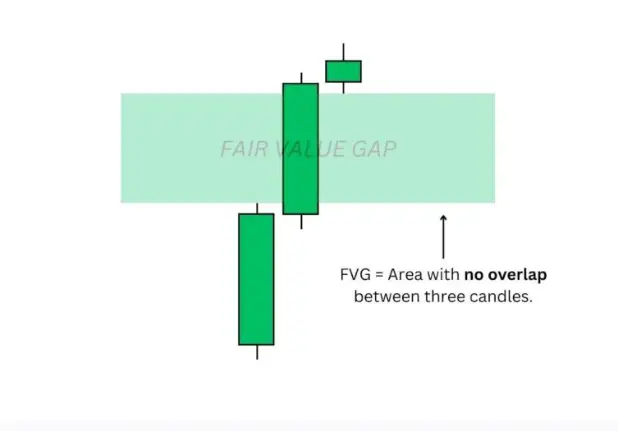
One of the most common and straightforward ways to identify an FVG is to use three candles. Fvgs involve a rapid movement among the 3 candles which describe the formation of an imbalance in price, involving a strong impulsive move (Candle 2) between an initial price level (Candle 1) and a subsequent reaction (Candle 3), creating a gap/void where the high of Candle 1 doesn’t overlap with the low of Candle 3 (bullish FVG) or vice-versa (bearish FVG).
How to Identify a Fair Value Gap on a Chart
As mentioned above, to identify a fvg on a chart, one should first examine the three-candle sequence. This candlestick sequence is a relationship between 3 consecutive candles.
Having established that, the following steps follow
- Confirm that the first Candle and third Candle leave a clean space.
- Compare the candle range
- Mark the FVG zone by drawing a box over the gap area on your chart.
- Label the direction, write “bullish FVG” or “bearish FVG” near it.
- Monitor the zone later, as the price may revisit it and react.
Types of FVGs
Bullish FVG
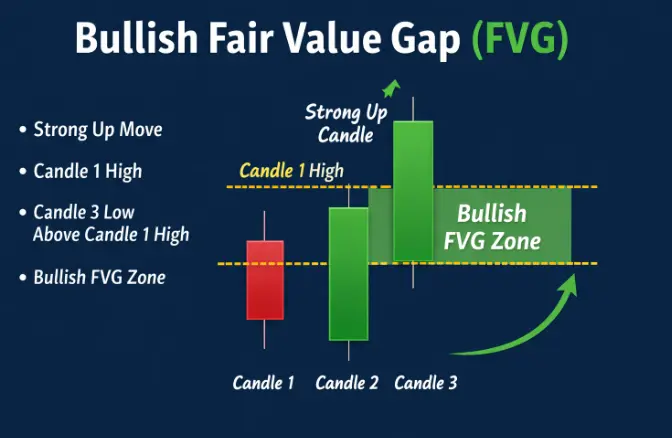
In a bullish Fair Value Gap, the price goes up rapidly. The gap zone is between Candle 1 high and Candle 3 low. Some traders note that the price may revisit the gap, but there is no guarantee that it will.
- This is typically a large, bullish (green) candle, often called an impulse candle, which some traders interpret as a strong price move
How to find a Bullish Fair Value Gap
- Spot or identify a three-candle sequence where the middle candle is the large impulse candle.
- Check for an “empty space” between the first and third candles. Specifically:
- The high of the first candle (Candle 1) must be lower than the low of the third candle (Candle 3).
- The price area between the high of Candle 1 and the low of Candle 3 is the FVG.
- Ensure the gap lies within the body of the middle (second) candle and that the wicks of the first and third candles do not touch each other in that price range. If the wicks overlap, the market has already traded efficiently in that zone, and there is no FVG.
- Mark the FVG zone on your chart, typically using a rectangle or horizontal lines. This area now serves as a point of interest for future price action.
Bearish FVG
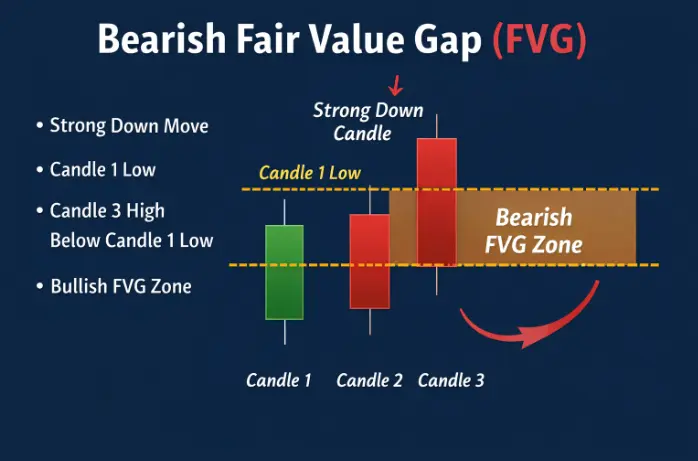
In a bearish Fair Value Gap, the price goes down rapidly. The “gap zone” is between the third Candle high and the first Candle low.
How to find a Bearish FVG
- Spot or identify the three sequence candles during a period of rapid downward price movement (often called “displacement”).
- Check for an empty space between the wicks of the first and third candles:
- The low of the candle 1 must be higher than the high of the candle 3.
- The space between these two wick levels constitutes the Bearish FVG area, indicating a supply-side imbalance in which sellers overwhelm buyers.
- There should be an empty space between these two wicks, meaning no price action from the first candle’s low extended down to meet the third candle’s high. This “gap” often sits within the body of the middle candle.
- Draw a rectangle or use an FVG indicator in the zone. This zone is sometimes seen as a potential area of interest, but there is no certainty about future price movements.
Fair Value Gaps vs Regular Gaps: What’s the Difference?
Traders often use the term “gap” to refer to two distinct phenomena. To avoid confusion, I provide further clarification.
A regular gap occurs in the financial market when a security price makes a significant upward or downward jump with little or no trading in between, thereby leaving a blank space on the chart. It shows up between two time periods on a chart.
A FVG is an imbalance in a fast move. It shows up within a run of candles, not between sessions.
1) Where the “gap” appears on the chart
Regular gap
- You see empty space between the last candle and the next one.
- The next candle opens above or below the prior close.
- It looks like the price “teleported” to a new level.
Fair value gap
- You see a “thin-trade zone” inside a strong move.
- It’s marked using a three-candle relationship.
- The candles remain synchronised in time, with no session break.
2) What causes each one
Regular gap
- Occurs when trading pauses or when prices reprice suddenly.
- Common triggers include earnings, big news, and weekends.
- It’s driven by “new info” arriving when liquidity differs.
Fair value gap
- Happens when the price moves too fast through levels.
- It’s driven by pressure and imbalance during active trading.
- Price didn’t spend time trading in that zone.
3) “Filling” behavior is not the same idea
People say “gaps get filled” and mean different things.
Regular gaps
- “Fill” means price trades back into the empty space.
- A full fill means the gap area gets traded through.
FVGs
- “Fill” means price revisits the imbalance zone.
- Many traders track partial fill and full fill differently.
- Some FVGs never get revisited for a long time.
The key point is simple. A revisit can happen, but nothing is guaranteed.
4) Market type matters
Forex
- Regular gaps often show on weekends and are open.
- FVGs can form any day during strong moves.
5) What traders usually confuse
Mistake
Calling every blank-looking zone a “gap.” Some charts show thin wicks and fast candles. That may appear as a gap, but it isn’t a session jump.
Fix
Ask one question.
“Did price jump between two candles in time?”
If yes, it’s a regular gap. If no, check the three-candle FVG rule.

What time frames are best for trading fair value gaps?
They can be identified at any time frame.
- Higher Timeframes (Daily, 4H): For identifying overall market direction and bias.
- Lower Timeframes (15-min, 5-min): For executing precise trade entries within the higher-timeframe context.
Common Fair Value Gap Mistakes and Fixes
Fair value gaps look simple on paper. In real charts, small mistakes ruin the idea fast. Traders make these mistakes as a result of overcomplicating the process
Here are some of the mistakes:
1) Marking every tiny gap
Mistake: You draw boxes on every small candle move. Your chart becomes noise rather than a plan.
Fix: Only mark gaps after a clear, strong push candle. Avoid gaps within slow, choppy movements.
2) Ignoring the higher timeframe
Mistake: Hunting FVGs on 1–5 minute charts only. You miss the main trend and key zones.
Fix: Start with higher timeframes market conditions, such as 4H or 1H, to identify the “big” move. Drop to 15M only to study the reaction.
3) Treating every FVG like a guaranteed magnet
Mistake: You assume the price must return and “fill” the gap. That belief creates forced decisions.
Fix: Treat an FVG as a watch zone rather than a promise. Price may return, delay, or ignore it.
4) Drawing the zone wrong
Mistake: Marking the wrong boundaries of the gap. Then you attribute the failure to the concept.
Fix: You either use the Bullish rule or the Bearish rule.
Bullish: zone is Candle 1 high to Candle 3 low.
Bearish: zone is Candle 3 high to Candle 1 low.
5) Using FVG without context
Mistake: You take any FVG anywhere on the chart. Some locations are weak and get run through.
Fix: Prefer FVGs that form after a break of structure (BoS). Also prefer FVGs near swing highs or swing lows.
6) Chasing price before it returns
Mistake: You see a gap and jump in right away. You get caught in the pullback you ignored.
Fix: Wait for the price to reach your marked zone. If it never returns, you simply skip it.
7) Overloading confirmation rules
Mistake: You’re stacking signals to feel safe. You end up late, or you never act.
Fix: Use only one or two simple checks. Example: trend direction + clear reaction candle at the zone.
8) Forgetting session and volatility changes
Mistake: You treat all hours the same. Some gaps form under thin conditions but often fail to do so.
Fix: Note when the gap formed. Strong, active hours often produce cleaner moves.
9) Not tracking results
Mistake: You rely on memory and vibes. Memory hides losses and boosts wins.
Fix: Screenshot, label, and log each FVG. Write why you marked it and what happened next. This is why keeping a journal is important.
Frequently Asked Questions
How do I identify a fair value gap on a trading platform?
Find a strong push, then check 3 candles: bullish if Candle 3 low > Candle 1 high, bearish if Candle 3 high < Candle 1 low.
Mark the space with a rectangle, or use an “FVG/Imbalance” indicator to auto-draw zones.
Which brokers offer tools to spot fvg easily?
Some trading platforms let users add FVG indicators and templates. Check your broker’s platform to see if this feature is available.
Can I use fair value gap analysis with automated trading software?
Yes. FVG rules are easy to code: detect the 3-candle gap, then trigger on revisits. Backtest and paper-test first, since spreads and slippage can change results.
Best apps for detecting fair value gaps in forex markets?
Many trading platforms, such as standard charting tools or third‑party indicator libraries, include Fair Value Gap indicators. Choose a platform you’re familiar with
RISK WARNING: CFDs are complex financial instruments and carry a high risk of rapid capital loss due to leverage. You should fully understand the risks involved and carefully consider whether you can afford to take the high risk of losing your money before trading.
Disclaimer: The information is provided for educational purposes only and doesn’t take into account your personal objectives, financial circumstances, or needs. It does not constitute investment advice. We encourage you to seek independent advice if necessary. The information has not been prepared in accordance with legal requirements designed to promote the independence of investment research. No representation or warranty is given as to the accuracy or completeness of any information contained within.
This material may include historical or past performance figures and should not be relied on. Furthermore, estimates, forward-looking statements, and forecasts cannot be guaranteed. The information on this site and the products and services offered are not intended for distribution to any person in any country or jurisdiction where such distribution or use would be contrary to local law or regulation.
References
- https://trendspider.com/learning-center/fair-value-gap-trading-strategy/ Fair Value Gap Learning Strategy
- https://www.investopedia.com/articles/trading/05/playinggaps.asp Gap Trading Strategies
- https://dailypriceaction.com/blog/fair-value-gap. Fair Value Gap Guide