
 Register
 Login
Login Register


US Q2 2026 Earnings Preview: High Bars and the Weeks That Will Test Them

Hebe Chen >
Senior Market Analyst
Hebe Chen >
Senior Market Analyst
 Updated Wed, 2026 July 15 03:53

The second-quarter corporate reporting cycle for 2026 is officially underway, and the market is gearing up for an exceptionally busy few weeks. If early indications are any guide, corporate America isn’t just navigating macroeconomic crosscurrents—it is consistently clearing a elevated bar.
The Top-Line Fundamentals: Growth at a Premium
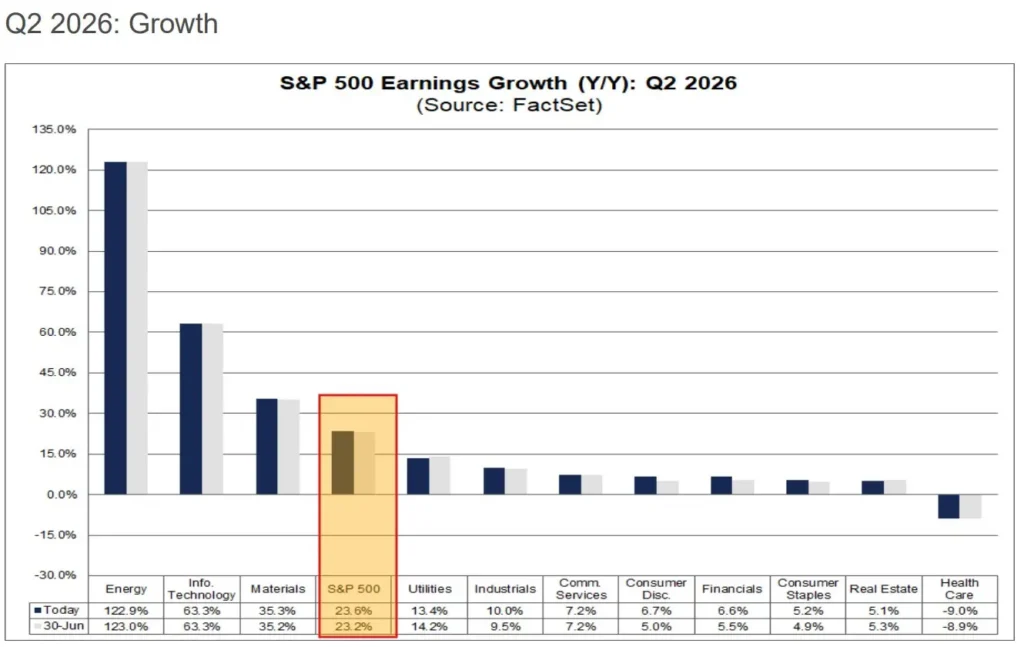
Heading into the peak of the season, aggregate projections point to a striking year-over-year earnings expansion of 23.6% for the S&P 500. Should these figures hold, it will signify the index’s second consecutive quarter delivering growth above the 20% threshold.
Source: Factset
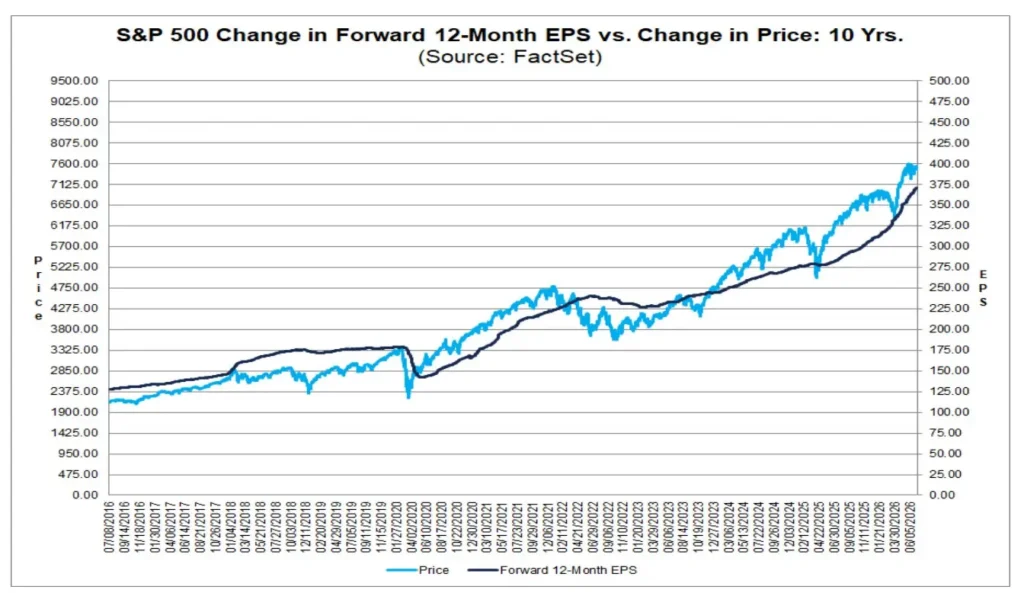
What’s more striking than the number itself is what happened to estimates along the way. Normally, analysts quietly trim their targets as the quarter unfolds — a ritual trimming of about 2.7% over the last decade. This time, bottom-up EPS estimates rose 3.4% from March 31 to June 30. Companies were helping raise it.
Another key catch is valuation. The S&P 500 forward P/E now sits at 20.5x, above both its five-year average of 19.9x and its ten-year mark of 19.0x. Markets are paying a premium for this performance. That means the margin for error when management teams step up to report is rather thin.
Source: Factset
Three sectors doing the heavy lifting
Ten out of eleven S&P sectors are on track for positive year-over-year growth. But three are doing the real work:
Energy — 122.9% earnings growth. Base effects are doing some of the work here, but don’t discount the structural story. Oil-weighted extraction and fuel marketing are both delivering. Geopolitical friction in Iran provided a massive tailwind that the Energy sector successfully capitalized on to become the market’s top performer.
Information Technology — 63.3% earnings growth, 34.2% revenue growth. Semiconductors are the engine inside the engine — hardware demand up 131% year-over-year. Tech isn’t just trying to outrun lingering AI valuation anxieties; it is actively fighting to justify its premium through hard fundamental growth.
Materials — 35.3% earnings growth. It is a quiet, less publicized success story: underlying raw material and manufacturing demand remains resilient, providing the sector with remarkably stable fundamental support this season.
Margins: still above the long-run line
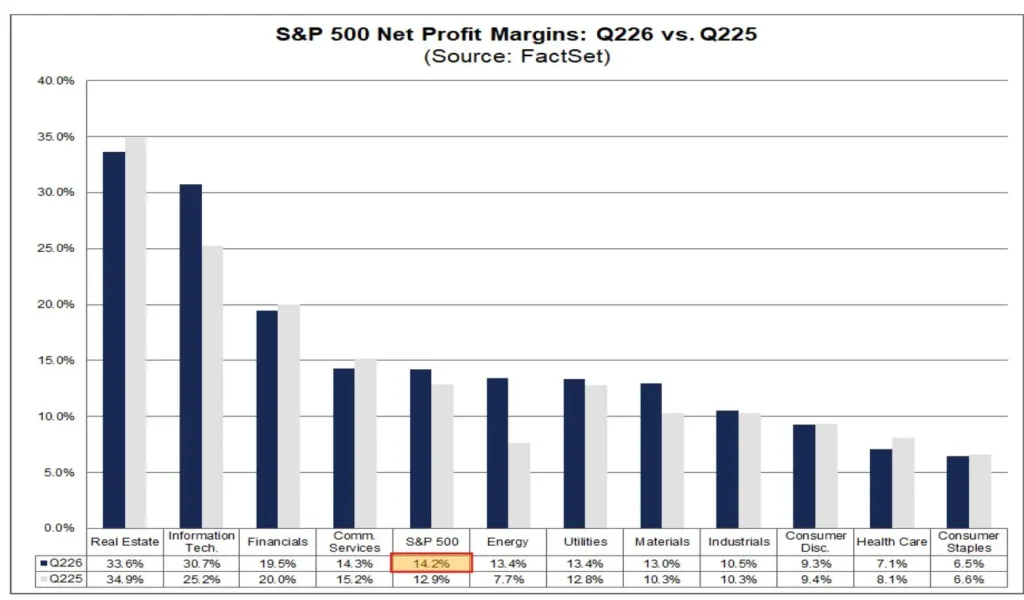
Net profit margin for the index sits at 14.2% — a step back from last quarter’s 14.8% record, but still well above the five-year average of 12.3%. The structural efficiency gains of the last few years haven’t unwound.
One detail worth watching: companies with more than half their sales outside the US are growing earnings at 31.4%, versus 20.3% for their domestic-focused peers. In a world of tariff noise and dollar volatility, international exposure is quietly becoming a differentiator again.
Source: Factset
The calendar that matters
- July 15 — Morgan Stanley, BlackRock
- July 16 — Netflix, TSMC
- July 22 — Alphabet, Tesla
- July 29 — Microsoft, Meta, Apple, Amazon
- August 3 — Palantir
- August 4 — AMD
- August 7 — Berkshire Hathaway
- August 26 — Nvidia
The first half of 2026 was defined by trends that moved far faster than anyone anticipated—geopolitical flashpoints, interest rate debates, and sharp asset reversals. Amid that volatility, Q2 earnings has emerged as the one chapter moving exactly as the optimists hoped. The critical question for the next six weeks is whether the remaining heavy hitters on the calendar will confirm this narrative—or write a completely different ending.
Disclaimer: The material provided here has not been prepared in accordance with legal requirements designed to promote the independence of investment research and as such is considered to be a marketing communication. Whilst it is not subject to any prohibition on dealing ahead of the dissemination of investment research we will not seek to take any advantage before providing it to our client. No representation or warranty is given as to the accuracy or completeness of this information and therefore it shouldn’t be relied upon as such. Any research provided does not have regard to specific financial situations, needs or investment objectives. Vantage accepts no responsibility for any use that may be made of these comments and for any consequences that result. Consequently, any person acting on it does so entirely at their own risk. We advise any readers of this material to seek professional advice where necessary. Without the approval of Vantage, reproduction or redistribution of this information isn’t permitted.
-

Open Trading Account
Discover the endless trading possibilities with our cutting-edge platform, designed to empower our traders. Practice trading the markets with a free demo account today.
-

Download Vantage App
Trade on the go with the Vantage All-In-One Trading App, where smooth execution and market access come together in the palm of your hand.
-

Start Trading
Are you an existing user? Login to your account to start trading 1,000+ CFD products including forex, indices, gold, shares and more.
