
 Register
 Login
Login Register


Australian inflation cools to 4.2% in April; AUD/USD recovery attempt faces key test

Hebe Chen >
Senior Market Analyst
Hebe Chen >
Senior Market Analyst
 Updated Wed, 2026 May 27 03:52

Softer headline CPI, firmer core pressure
Preview: The ASX 200 remains fragile, AUD/USD is testing a key recovery zone, and gold is stabilising after recent pressure
Australia’s annual CPI eased to 4.2% in April, down from 4.6% in March, signalling some moderation in headline inflation pressures. The largest contributors to annual inflation were housing (+6.3%), transport (+6.6%) and food and non-alcoholic beverages (+2.8%). However, underlying inflation remains sticky, with trimmed mean inflation edging up to 3.4% from 3.3%. The softer headline print may provide some brief relief on inflation concerns and could encourage markets to lean toward a pause at the June RBA meeting. Still, with inflation remaining above the RBA’s target band, the outlook for further tightening is likely to stay firmly in focus. Wall Street delivered a mixed lead overnight. The S&P 500 and Nasdaq climbed to fresh record highs, supported by strength in technology, industrials and materials, while the Dow Jones slipped 118 points. Investors remained cautiously optimistic that the US and Iran may still move toward an agreement, although renewed strikes and uncertainty around the Strait of Hormuz continue to keep geopolitical risk on the table. Oil prices stabilised, with WTI crude holding above US$93 a barrel after a sharp fall earlier this week. Gold also steadied above US$4,500 an ounce, supported by lingering Middle East tensions but capped by expectations that an energy-driven inflation shock could keep major central banks tighter for longer.
ASX 200 — Holding Support, But Momentum Still Fragile
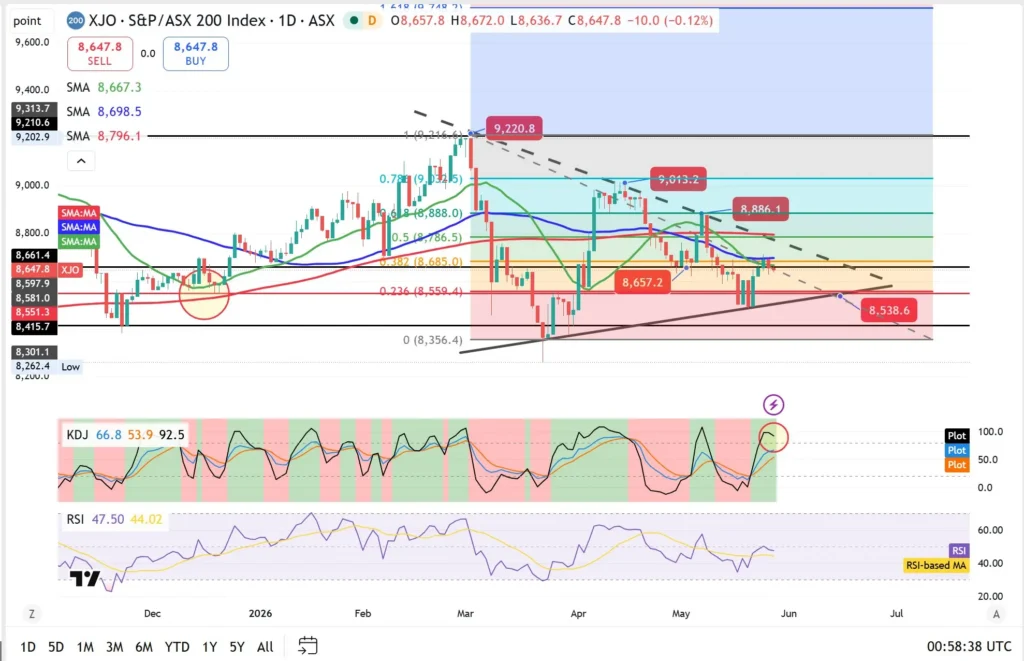
The ASX 200 remains trapped in a cautious consolidation zone after failing to regain stronger upside momentum. The index is trading near 8,648, sitting below the 20-day and 50-day moving averages, suggesting the short-term trend remains soft. Immediate support sits around 8,580–8,540, with a deeper floor near 8,415. A break below this area would increase downside risk and potentially open the way for a retest of the March lows. On the upside, the first key resistance zone is around 8,660–8,700, followed by 8,780 and 8,886. The RSI remains below 50, pointing to weak momentum, while the KDJ indicator has rebounded but is already showing signs of hesitation. For now, the index needs a clean break above the moving-average cluster to shift the tone from defensive to more constructive.
Chart 2: AUD/USD — Recovery Attempt Faces Key Test
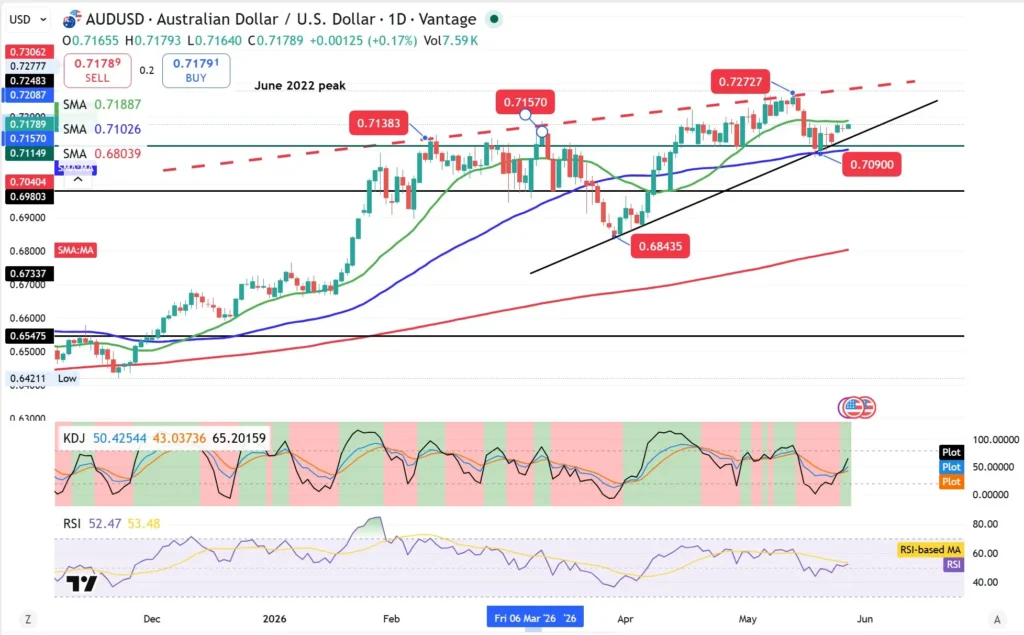
AUD/USD is attempting to rebuild momentum after holding above the 0.7100 support zone and rebounding toward 0.7180. The pair remains supported by an upward trendline from the April low, while the 50-day moving average near 0.7100 continues to act as an important technical floor. The next upside test sits around 0.7200–0.7280. A sustained break above this region would improve the technical picture and suggest the Aussie could retest its recent highs. However, failure to clear resistance may keep the pair range-bound, especially if today’s CPI data reinforces RBA caution without delivering a clear hawkish surprise. Momentum is improving, but not yet decisive. The RSI is sitting near neutral levels, while the KDJ indicator has turned higher, suggesting short-term buyers are returning. The key question now is whether the Aussie can turn this bounce into a broader breakout.
Gold — Stabilising, But Downtrend Pressure Remains
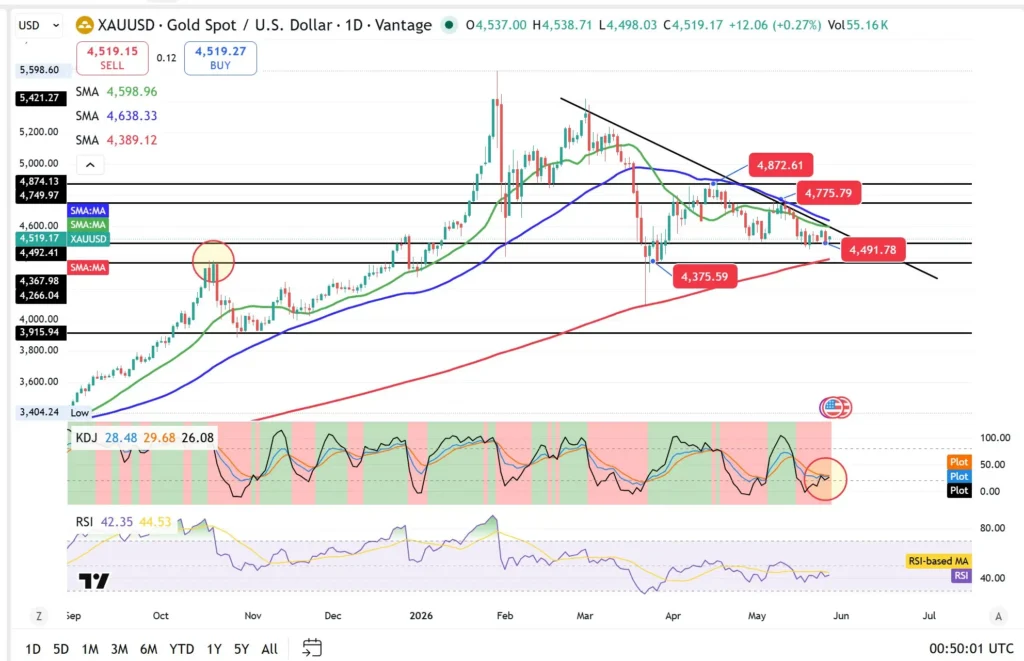
Gold is holding above US$4,500 an ounce, but the technical picture remains mixed. The metal is still trading below its 20-day and 50-day moving averages, while a descending trendline from the March peak continues to cap upside momentum. This suggests gold is stabilising rather than breaking out. Immediate support sits near US$4,490, followed by US$4,375 and the 200-day moving average near US$4,389. A break below this zone would expose gold to a deeper pullback. On the upside, first resistance sits around US$4,640–US$4,750, with a stronger ceiling near US$4,875. The RSI remains soft but has stabilised above oversold territory, while the KDJ indicator is trying to turn higher from a low base. Gold may need either a fresh geopolitical shock or a softer inflation and rates backdrop to regain stronger upside momentum.
Disclaimer: The material provided here has not been prepared in accordance with legal requirements designed to promote the independence of investment research and as such is considered to be a marketing communication. Whilst it is not subject to any prohibition on dealing ahead of the dissemination of investment research we will not seek to take any advantage before providing it to our client. No representation or warranty is given as to the accuracy or completeness of this information and therefore it shouldn’t be relied upon as such. Any research provided does not have regard to specific financial situations, needs or investment objectives. Vantage accepts no responsibility for any use that may be made of these comments and for any consequences that result. Consequently, any person acting on it does so entirely at their own risk. We advise any readers of this material to seek professional advice where necessary. Without the approval of Vantage, reproduction or redistribution of this information isn’t permitted.
-

Open Trading Account
Discover the endless trading possibilities with our cutting-edge platform, designed to empower our traders. Practice trading the markets with a free demo account today.
-

Download Vantage App
Trade on the go with the Vantage All-In-One Trading App, where smooth execution and market access come together in the palm of your hand.
-

Start Trading
Are you an existing user? Login to your account to start trading 1,000+ CFD products including forex, indices, gold, shares and more.
