
RBA pauses, but caution remains as ASX rally takes a breather

Hebe Chen >
Senior Market Analyst
Hebe Chen >
Senior Market Analyst

RBA caution keeps ASX rally in check
Australian shares opened lower on Wednesday after three straight sessions of gains, with the S&P/ASX 200 falling 0.3% to 8893.9 by 10.13am AEST.
Investors are digesting the Reserve Bank of Australia’s latest rate pause while looking ahead to the US Federal Reserve’s policy decision. The RBA’s June decision to keep the cash rate unchanged at 4.35% has not fully settled the outlook. The key message for markets is that the pause was not a dovish pivot. The central bank made it clear that inflation is still too high and that it remains prepared to raise the cash rate again if required.
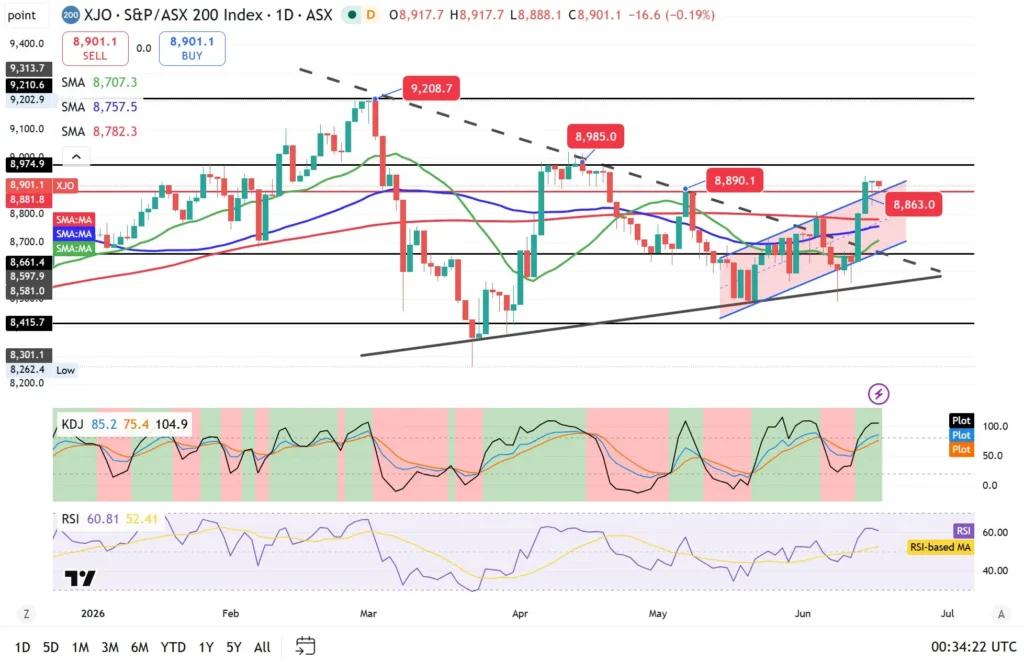
ASX 200 — rally pauses near resistance
The local market closed at a two-month high on Tuesday, helped by falling oil prices and improving risk sentiment. But the RBA’s still-cautious tone has made it harder for investors to chase the rally without clearer evidence that inflation is moving sustainably lower.
The ASX 200 is holding around 8900 after its recent breakout attempt, but the index is now testing whether it can extend beyond the 8975–8985 resistance zone.
The key positive is that the index remains above its major moving averages, with the short- and medium-term averages clustered around 8707, 8757 and 8782. That keeps the broader recovery structure intact for now.
The next resistance sits around 9202–9210, followed by 9314. On the downside, immediate support is near 8863, followed by 8661. A break below 8661 would weaken the recent bullish setup and bring the lower support zone near 8416 back into focus.
Oil slides as US-Iran interim deal raises supply hopes
Crude oil traded near three-month lows below US$77 per barrel on Wednesday, extending losses for a fourth straight session.
The pressure is coming from expectations that a US-Iran interim agreement could restore oil flows through the Persian Gulf and allow Tehran to resume oil exports. If confirmed, the deal would remove part of the geopolitical risk premium from energy markets and help ease inflation concerns.
That matters for equities and central banks. Lower oil prices can cool headline inflation and give policymakers more room to wait. But for energy-linked names, the same move can also create earnings pressure after the sector had previously benefited from supply-risk pricing.
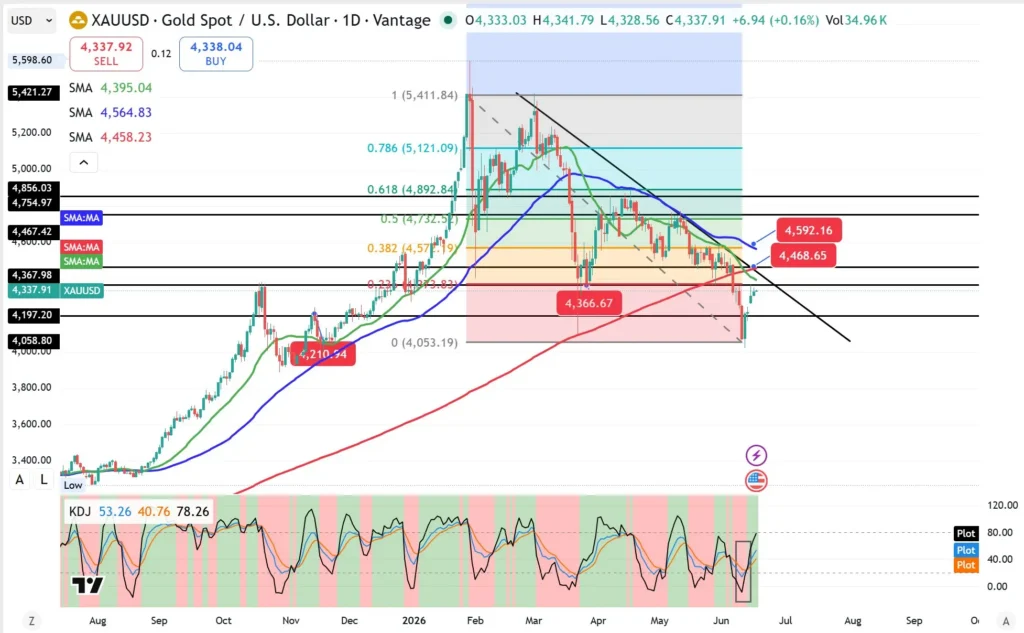
Gold — holds above US$4,300, but the trendline break still matters
Gold traded above US$4,300 per ounce on Wednesday and is up more than 2% so far this week, helped by hopes that lower oil prices could ease inflation and interest-rate pressure.
Still, the technical picture remains more cautious than the headline move suggests. Gold has bounced from recent lows, but the price remains below its longer-running descending trendline and below key moving averages. That means the latest move still looks more like a recovery attempt than a confirmed trend reversal.
The first resistance sits around US$4,368–US$4,374, followed by US$4,468. A stronger recovery would need a clean break above this zone, with the next resistance sitting around US$4,565–US$4,592.
On the downside, US$4,197 is the first support, followed by the recent low area around US$4,058. KDJ has rebounded sharply, which supports the case for a near-term bounce, but the broader setup remains cautious while gold stays below the long-term trendline.
Fed decision becomes the next test for risk appetite
The US Federal Reserve is widely expected to leave interest rates unchanged this week, but the bigger focus is the policy outlook under new chair Kevin Warsh.
Markets are watching whether the Fed leans into the recent improvement in inflation expectations, especially as oil prices retreat, or keeps a more cautious tone given the still-uncertain macro backdrop.
A steady Fed with a softer inflation message could support risk assets, while a more hawkish tone would likely test the recent strength in equities, the Australian dollar and gold.
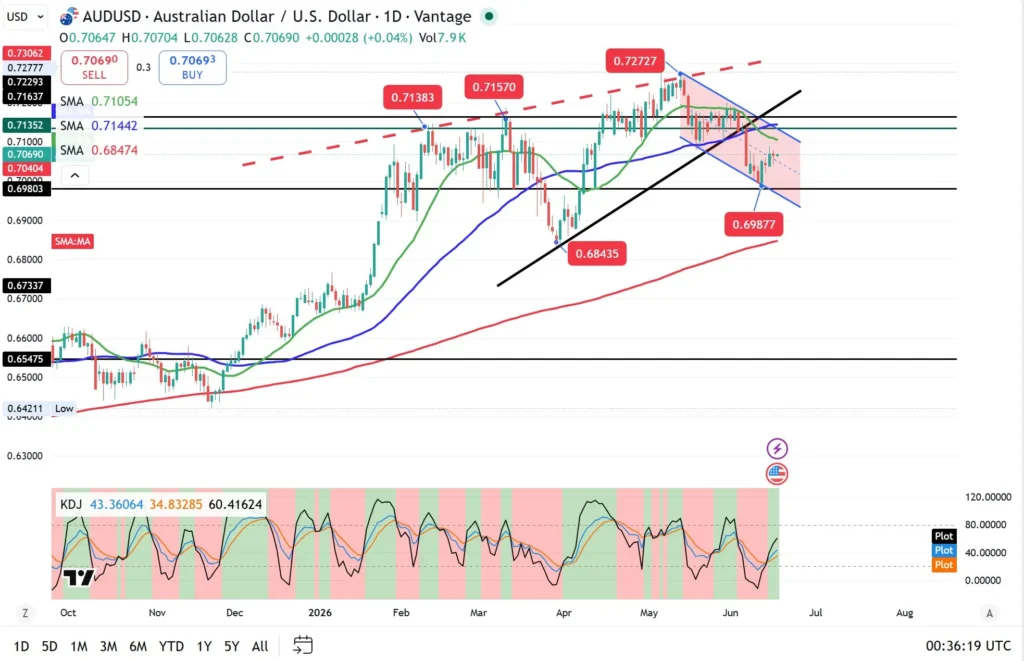
AUD/USD — rebound needs further confirmation
AUD/USD is trying to recover near 0.7070, but the pair remains trapped inside a short-term descending channel.
The first major test is the 0.7100–0.7135 resistance zone, which also sits close to the 20-day moving average near 0.7105. A break above this area would improve the short-term picture, but stronger confirmation would need a move above the 50-day moving average near 0.7144.
Until that happens, the rebound still looks corrective. The key downside level remains around 0.6980–0.6988. A break below that zone would suggest the recent bounce has failed and could expose the 200-day moving average area near 0.6847.
KDJ is turning higher from low levels, pointing to a short-term recovery attempt. But for AUD/USD, the real confirmation still needs to come from a sustained move back above the 0.7135–0.7144 zone.
Disclaimer: The material provided here has not been prepared in accordance with legal requirements designed to promote the independence of investment research and as such is considered to be a marketing communication. Whilst it is not subject to any prohibition on dealing ahead of the dissemination of investment research we will not seek to take any advantage before providing it to our client. No representation or warranty is given as to the accuracy or completeness of this information and therefore it shouldn’t be relied upon as such. Any research provided does not have regard to specific financial situations, needs or investment objectives. Vantage accepts no responsibility for any use that may be made of these comments and for any consequences that result. Consequently, any person acting on it does so entirely at their own risk. We advise any readers of this material to seek professional advice where necessary. Without the approval of Vantage, reproduction or redistribution of this information isn’t permitted.
-

Open Trading Account
Discover the endless trading possibilities with our cutting-edge platform, designed to empower our traders. Practice trading the markets with a free demo account today.
-

Download Vantage App
Trade on the go with the Vantage All-In-One Trading App, where smooth execution and market access come together in the palm of your hand.
-

Start Trading
Are you an existing user? Login to your account to start trading 1,000+ CFD products including forex, indices, gold, shares and more.
