
ASX 200 Attempts to Recover on Monday

Christopher Lewis >
Market Analyst
Christopher Lewis >
Market Analyst

- ASX 200 looks to continue recovery.
- Very mixed underneath the hood.
- United States following suit on Monday.
The ASX 200 showed strength Monday morning, climbing toward the 7,900 level. While this marks a step in the right direction, a sustained shift to an upward trend remains uncertain. Breaking above 7,900 could serve as a psychological boost, but broader market conditions will ultimately dictate the index’s trajectory.
Global indices have also shown signs of recovery, yet Australia’s market remains highly sensitive to external economic factors. Given this, cautious optimism is warranted. That said, recent sessions suggest a resurgence of value-driven investors, indicating potential support at current levels.

National Australia Bank Limited (NAB)
National Australia Bank declined by 0.18% during the session, extending what has been a particularly difficult month. Over the month, NAB has lost nearly 19% bringing its year-to-date return to -1.69%. The financial giant continues to face significant challenges, mirroring broader struggles across the sector.
Investment in new growth remains constrained by ongoing concerns over potential tariff wars and uncertainty surrounding the global economy. The AU$33 level has historically been a key support area. However, the recent formation of a “death cross” where the 50-day EMA crosses below the 200-day EMA signals potential further downside pressure.

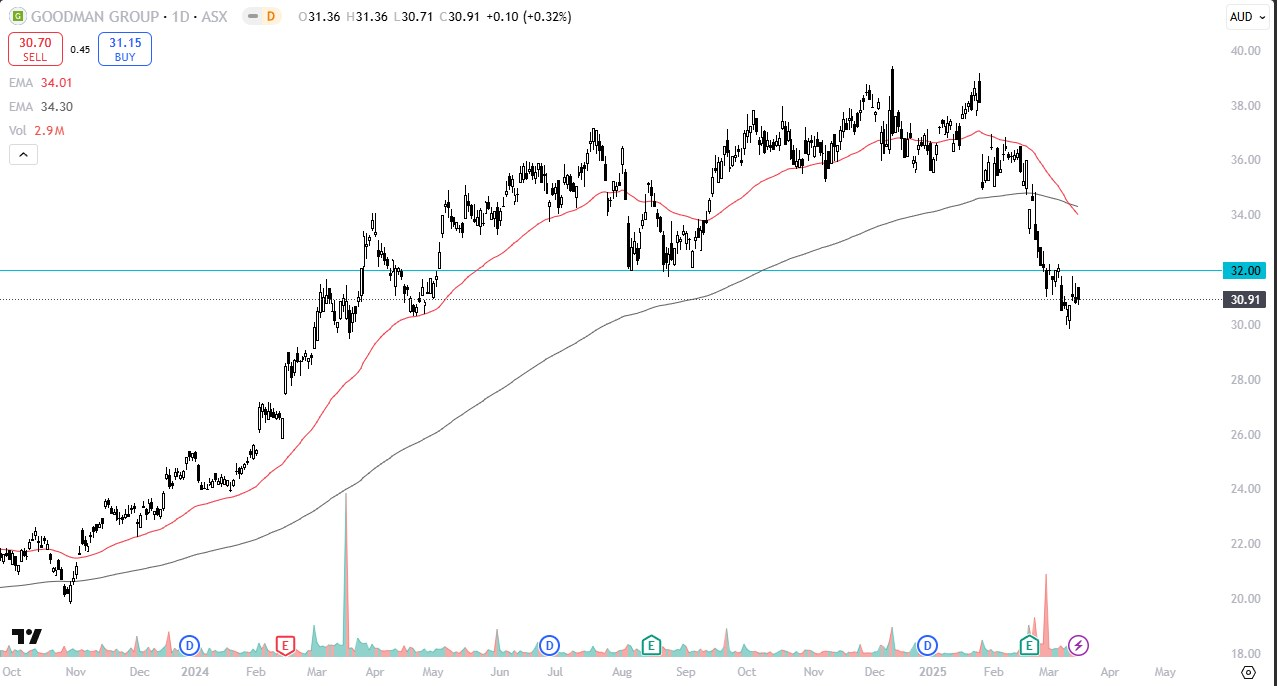
Goodman Group (GMG)
Goodman Group surged 40.33% during Monday’s trading session, continuing its volatile trajectory over the past year. However, the last month has been particularly challenging, with GMG declining by 13.20%. Despite this, the stock remains up 0.16% on a yearly basis. Currently, GMG is trading just below the AU$32 level, a key area that previously acted as support.
A breakout above this level could trigger renewed buying interest, potentially driven by “FOMO trading”. However, from a technical perspective, the recent crossover of the 50-day EMA below the 200-day EMA, a formation known as the “death cross” suggests potential downside risks in the near term.
Coles Group Limited (COL)
Coles Group declined by 0.54% during the trading session but remains up 11.38% for the year as the consumer staples giant continues to hover around the AU$18.50 level. Notably, Monday’s candlestick formed a significant hammer pattern at the 200-day EMA, a technically bullish signal.
At this stage, COL may be attempting to establish a bottom following a short-term pullback, though confirmation remains uncertain. Additionally, the stock is currently trading between the 200-day EMA and the 50-day EMA, an area that often exhibits increased market noise and indecision.

James Hardie Industries Plc (JHX)
James Hardie Industries rallied 40.44% during Monday’s trading sessions as the materials giant continues its recovery from a significant decline over the past year. Despite this rally, the stock remains down 15.29% over the last 12 months. The AU$49 level has emerged as a key support zone and it will be interesting to see whether buyers return to capitalise on perceived value at this level.

Disclaimer: The material provided here has not been prepared in accordance with legal requirements designed to promote the independence of investment research and as such is considered to be a marketing communication. Whilst it is not subject to any prohibition on dealing ahead of the dissemination of investment research we will not seek to take any advantage before providing it to our client. No representation or warranty is given as to the accuracy or completeness of this information and therefore it shouldn’t be relied upon as such. Any research provided does not have regard to specific financial situations, needs or investment objectives. Vantage accepts no responsibility for any use that may be made of these comments and for any consequences that result. Consequently, any person acting on it does so entirely at their own risk. We advise any readers of this material to seek professional advice where necessary. Without the approval of Vantage, reproduction or redistribution of this information isn’t permitted.
-

Open Trading Account
Discover the endless trading possibilities with our cutting-edge platform, designed to empower our traders. Practice trading the markets with a free demo account today.
-

Download Vantage App
Trade on the go with the Vantage All-In-One Trading App, where smooth execution and market access come together in the palm of your hand.
-

Start Trading
Are you an existing user? Login to your account to start trading 1,000+ CFD products including forex, indices, gold, shares and more.
