


[DAILY TRADING] USDX Analysis 23 July 2026 – Dollar Index Chart Stuck at 100.80 Before the Fed

Vantage Editorial Team >
Vantage Editorial Team >
Vantage is a global, multi-asset broker with a team of in-house writers and market analysts who produce educational and insightful trading content for traders of all levels.
 Updated Thu, 2026 July 23 06:58
![[DAILY TRADING] USDX Analysis 23 July 2026 – Dollar Index Chart Stuck at 100.80 Before the Fed](https://www.vantagemarkets.com/wp-content/uploads/2026/06/usdx_hero-1.webp)
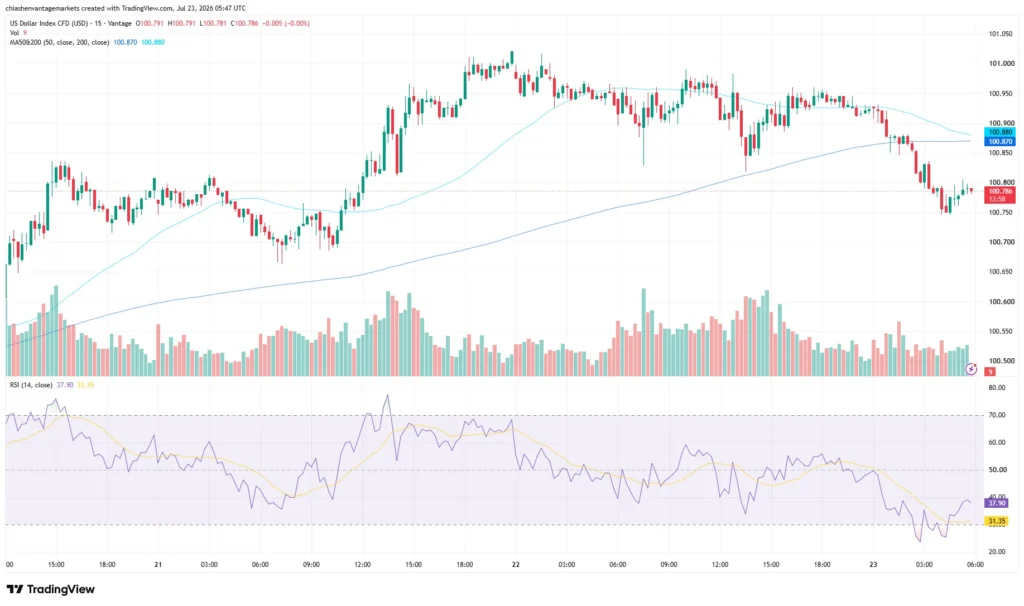
The Vantage USDX CFD traded at 100.786 as of 05:47 UTC (13:47 GMT+8) on 23 July 2026, after a week that took the index from around 100.65 to above 101.00 and back again. Prices below come from the Vantage US Dollar Index CFD and the TradingView setup used for this analysis. This is not financial advice.
What the USDX chart is showing
Zoom into the 15-minute USDX chart and two moves stand out. The u.s. dollar index consolidated near 100.65 to 100.80 through 20 and 21 July, then a sharp rally lifted it above 101.00 during the 21 July 2026 session, the week’s high. That strength didn’t hold. Price gave the gains back through 22 July 2026 and slid into the Asian session on 23 July 2026, testing 100.70 to 100.75 before levelling off near 100.786.
That pullback has dragged price back beneath both moving averages on this setup. The 50-period average sits at 100.870 and the 200-period at 100.880, a gap so narrow the two lines are practically touching, per the TradingView setup used for this analysis. Earlier this week, on this same chart, USDX was still trading above that cluster; now it sits just underneath it, which says more about the past few days’ selling than about what comes next.
RSI reads 37.90, above its moving-average overlay at 31.35, the TradingView setup used for this analysis shows. It dipped into oversold territory earlier in the Asian session before recovering to 37.90, indicating that downside momentum has eased somewhat without yet confirming a reversal. The dollar index graph is not giving a clean signal either way.
Middle East conflict keeps traders guessing

If there’s one theme running through every US dollar index DXY chart this month, it’s that geopolitics keeps rewriting the script before the ink dries. Strikes between the US and Iran have continued this week, with attacks on the Caspian Pipeline Consortium terminal and Houthi-led disruption of Red Sea shipping adding to supply-side pressure on energy markets1,2. Brent crude and WTI have both firmed, keeping inflation risk in play even as some of the earlier war premium has unwound2.
Higher energy prices can reinforce inflation concerns and expectations for tighter Fed policy, potentially supporting the dollar through rate differentials. At the same time, geopolitical risk can redirect safe-haven flows across the dollar, yen and gold, complicating the USDX reaction and leaving the DXY index without a clean driver either way.
A cautious Fed heads into its blackout week
Fed Chair Kevin Warsh told Congress this month, testifying before the House on 14 July 2026 and the Senate on 15 July 2026, that policymakers remained committed to restoring price stability, while giving little guidance on the immediate direction of rates3. US private-sector hiring slowed for a fourth straight week, according to ADP’s preliminary NER Pulse estimate, a four-week moving average putting weekly job additions at 16,500 for the period to 4 July 2026, down from 19,250 previously7.
Jobless claims told a steadier story, falling to 208,000 in the week to 11 July 2026, the lowest in two months4. June retail sales rose 0.2% month-on-month, while the retail-sales control group increased 0.5%5. None of it has handed the USDX chart a clean signal.
With the Fed approaching its 28 to 29 July 2026 meeting, policymakers are now in the pre-meeting blackout period, so no further remarks are due before then. Markets continue to expect a hold at that meeting, although renewed energy-driven inflation risk has kept further tightening later this year in focus6. The ECB’s own decision lands today, 23 July 2026, with US flash PMI due Friday, 24 July 2026, among the final major data releases before the Fed convenes5.
Levels traders are watching
Here’s where the us dollar index sits against its recent range right now.
| Zone | Level | Reference | What’s Happening |
| Immediate support | 100.75 to 100.78 | 23 July 2026 session | Nearest floor tested during today’s Asian-session slide |
| Lower support | 100.65 to 100.70 | 21 to 22 July 2026 range | Deeper floor from earlier in the week |
| MA cluster | 100.870 to 100.880 | MA50 and MA200 | Both averages now sit just above current price |
| Resistance | 100.95 to 101.05 | 21 July 2026 session high | Week’s high, not retested since the pullback began |
Table 1: Reference levels as of 05:47 UTC (13:47 GMT+8), 23 July 2026. Sources: Vantage USDX CFD, TradingView. Indicative only, not trade signals.
What to watch this week
- ECB Rate Decision, 23 July 2026: The European Central Bank’s policy announcement lands today and could move EURUSD, the largest single component of the USDX basket.
- Flash PMI, 24 July 2026: July’s flash manufacturing and services readings are among the last major US data points before the Fed meets.
- FOMC Meeting, 28 to 29 July 2026: The Federal Reserve’s next scheduled rate decision, with no Summary of Economic Projections at this meeting.
USDX has traded within roughly the 100.65-to-101.05 range this week, with the current level sitting in the lower half of that band, closer to immediate support than to the week’s high. Given the speed of recent geopolitical moves across USDX, gold and the yen, gap and slippage risk remains relevant. A Stop Loss can help define an intended exit level, but execution may occur away from that level during abrupt moves, so checking combined exposure across correlated positions is worth doing before the blackout period ends.
Leverage remains a double-edged tool heading into a week stacked with an ECB decision, a flash PMI print, and a Fed meeting still to come. It can magnify gains as easily as losses, so position sizing relative to account equity is worth revisiting.

RISK WARNING: CFDs are complex financial instruments and carry a high risk of losing money rapidly due to leverage. You should ensure you fully understand the risks involved and carefully consider whether you can afford to take the high risk of losing your money before trading.
Disclaimer: The information is provided for educational purposes only and doesn’t take into account your personal objectives, financial circumstances, or needs. It does not constitute investment advice. We encourage you to seek independent advice if necessary. The information has not been prepared in accordance with legal requirements designed to promote the independence of investment research. No representation or warranty is given as to the accuracy or completeness of any information contained within. This material may contain historical or past performance figures and should not be relied on. Furthermore estimates, forward-looking statements, and forecasts cannot be guaranteed. The information on this site and the products and services offered are not intended for distribution to any person in any country or jurisdiction where such distribution or use would be contrary to local law or regulation.
References
[1] “United States Dollar – Trading Economics” https://tradingeconomics.com/united-states/currency Accessed on 23 July 2026.
[2] “Dollar Gains as US-Iran War Gauged; Sterling Eases as Burnham Steps In – Reuters via U.S. News & World Report” https://money.usnews.com/investing/news/articles/2026-07-19/dollar-firmer-as-us-iran-conflict-intensifies-brent-hits-90 Accessed on 23 July 2026.
[3] “Warsh Testimony, Iran Escalation Set to Drive Markets During Busy Earnings Week – Investing.com” https://www.investing.com/analysis/warsh-testimony-iran-escalation-set-to-drive-markets-during-busy-earnings-week-200683903 Accessed on 23 July 2026.
[4] “United States Initial Jobless Claims – Trading Economics” https://tradingeconomics.com/united-states/jobless-claims Accessed on 23 July 2026.
[5] “US Dollar Price Forecast: Fed and ECB Rate Decisions – Yahoo Finance” https://finance.yahoo.com/markets/currencies/articles/us-dollar-price-forecast-fed-055617615.html Accessed on 23 July 2026.
[6] “Fed to Hold Rates This Year Despite High Inflation, but Economists Cite High Chances of a Hike: Reuters Poll – Investing.com” https://www.investing.com/news/economy-news/fed-to-hold-rates-this-year-despite-high-inflation-but-economists-cite-high-chances-of-a-hike-reuters-poll-4803207 Accessed on 23 July 2026.
[7] “ADP National Employment Report Preliminary Estimate for July 4, 2026 – ADP Research / PR Newswire” https://www.prnewswire.com/news-releases/adp-national-employment-report-preliminary-estimate-for-july-4-2026-302829949.html Accessed on 23 July 2026.
