


[DAILY TRADING] Crude Oil Price Today, 23 July 2026 – Brent Near $94, WTI Above $89 as Tensions Build

Vantage Editorial Team >
Vantage Editorial Team >
Vantage is a global, multi-asset broker with a team of in-house writers and market analysts who produce educational and insightful trading content for traders of all levels.
 Updated Thu, 2026 July 23 05:24
![[DAILY TRADING] Crude Oil Price Today, 23 July 2026 – Brent Near $94, WTI Above $89 as Tensions Build](https://www.vantagemarkets.com/wp-content/uploads/2026/06/UKOUSD_USOUSD_banner_900x430_optimized-1.webp)
Oil prices today are holding just below a six-week high. Brent crude oil price (UKOUSD) traded near $94.29 a barrel and WTI crude oil price (USOUSD) sat around $89.01 as of 03:21 (UTC) / 11:21 (GMT+8) on 23 July 2026. Both benchmarks have added roughly a fifth of their value in a month, and the reason isn’t hard to find: the Middle East conflict is back in the headlines, and shipping lanes are feeling it.
Prices are attributed to the Vantage UKOUSD and USOUSD CFD feeds and are accurate as of the stated cut-off. Charts are indicative and sourced from TradingView. This is not financial advice.
What today’s oil price chart is showing
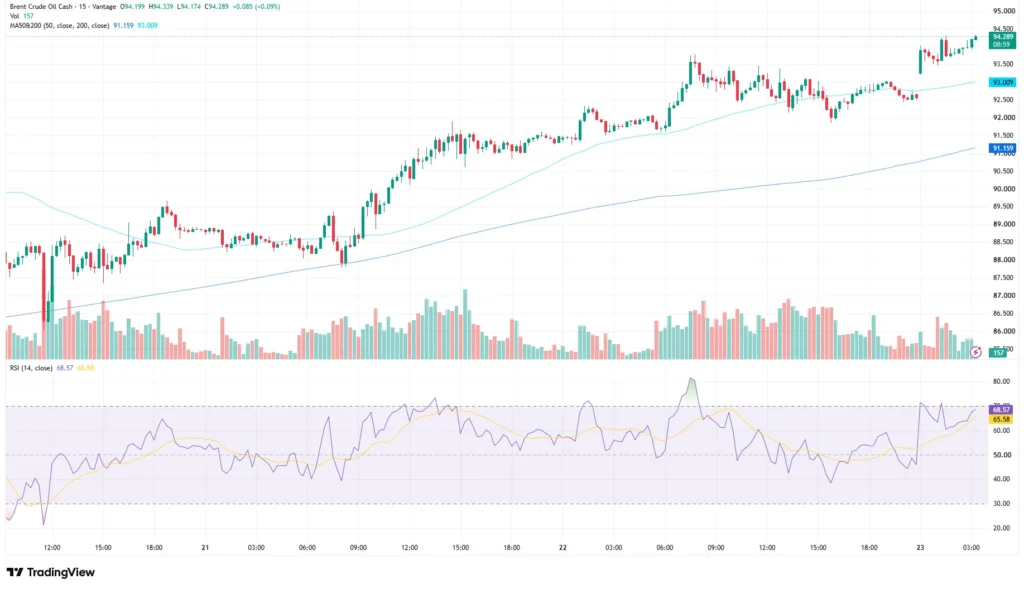
Brent (UKOUSD) opened at $94.20, ranged between $94.17 and $94.34, and last changed hands at $94.29; the latest 15-minute bar was up 0.09%. That’s a small move on the surface, but it’s happening well above both the 50-period moving average (91.16) and the 200-period (93.01), per the RSI reading from the TradingView setup used for this analysis: RSI at 68.57, above its 65.58 moving-average overlay, brushing overbought without quite tipping into it.
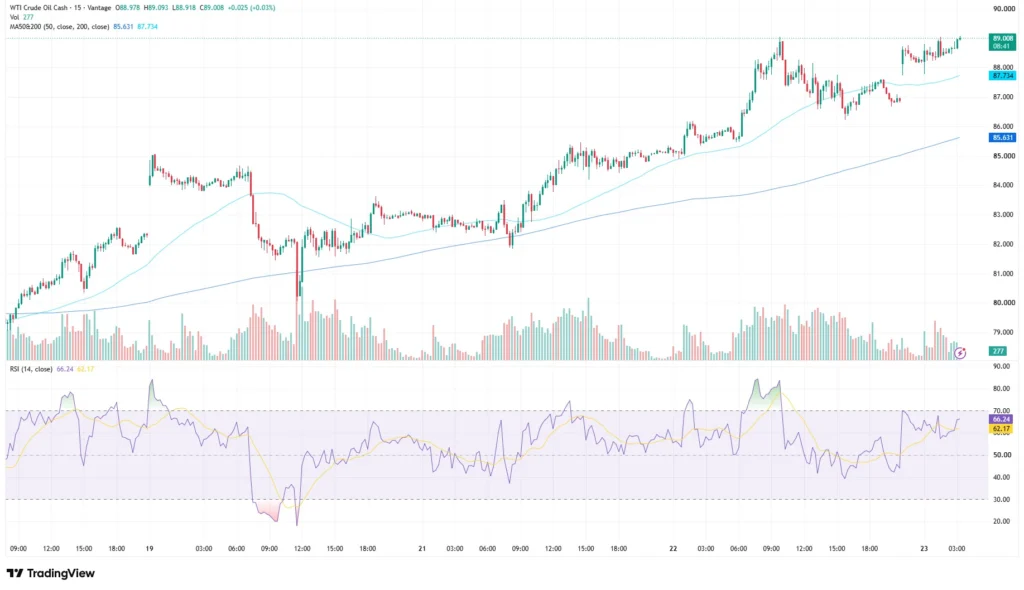
WTI (USOUSD) is telling a near-identical story from a different angle. WTI opened at $88.98, ranged from $88.92 to $89.09, and last printed $89.01; the latest 15-minute bar was up 0.03%. It’s also trading above its 50-period (85.63) and 200-period (87.73) moving averages, with RSI at 66.24, above its 62.17 moving-average overlay.
Neither chart is flashing a reversal yet. Both benchmarks have maintained an upward bias since mid-July despite several intraday pullbacks.
Why crude oil prices are climbing again

This isn’t a supply shock out of nowhere. It’s an escalation that has been building for weeks. US forces have now carried out eleven consecutive nights of strikes on Iranian military targets, and Washington has reinstated pressure around the Strait of Hormuz. [1]
US Secretary of State Marco Rubio said Washington remains open to a diplomatic solution but accused Iran of failing to honour earlier commitments, insisting any future agreement guarantee free passage through the strait. [1]
The tanker traffic tells its own story. Energy intelligence firm Kpler reported that vessel transits through the strait fell for a second straight day this week. [2] Reuters reported that two Saudi-loaded tankers reversed course in the Red Sea after Houthi threats, while separate reports pointed to an attack on the Caspian Pipeline Consortium terminal on Russia’s Black Sea coast, a route carrying Kazakh crude. [3] [4] None of that pressure is contained to one chokepoint anymore, which is part of why both benchmarks have moved this fast.
The one number the rally is ignoring
Not every data point matches the supply-crisis narrative. US EIA figures showed crude oil stocks unexpectedly rose by 2.0 million barrels last week, against expectations for a draw. [5] In a market currently trading on headlines out of the Gulf and the Red Sea, that build has barely registered. It’s a reminder that the physical supply picture and the price action on the oil price chart aren’t always telling the same story.
Levels traders are watching
The table below covers the zones traders are monitoring across both crude oil prices today. These are reference levels, not trade signals.
| Pair | Support | Resistance | What’s happening |
| UKOUSD (Brent) | 93.00 / 91.15 | 94.50 / 96.00 | Holding above both moving averages as Middle East risk stays elevated |
| USOUSD (WTI) | 87.75 / 85.65 | 89.10 / 90.00 | Trading near a six-week high on supply-disruption concerns |
Table 1: Support and resistance levels as of 03:21 (UTC) / 11:21 (GMT+8), 23 July 2026. Sources: TradingView, Vantage CFD feed. Indicative only.
Both benchmarks remain sensitive to headlines out of the Gulf and the Red Sea. A confirmed easing of tensions around the strait, or progress on the diplomatic track discussed earlier this year, would likely coincide with a pullback toward the moving averages above. Continued disruption to tanker traffic would likely keep both contracts supported near current levels.
What to watch next
- Strait of Hormuz transit data, ongoing: Kpler’s vessel-tracking updates remain one of the clearest real-time reads on how much shipping disruption is actually happening, versus what’s merely being threatened.
- EIA Weekly Petroleum Status Report, next release 29 July: A second consecutive inventory build would widen the gap between the supply data and the risk premium currently priced into both benchmarks.
- Diplomatic signals around the Strait of Hormuz: any confirmed step back from the current escalation would be the clearest catalyst for a pullback in both crude oil prices today. Our previous coverage of this move has more on how this rally has developed since mid-July.
Given how quickly headlines out of the Gulf and the Red Sea have moved both benchmarks this month, Stop Loss discipline relative to the levels above is one of the factors traders are watching, alongside overall account exposure to energy-linked instruments. In a market moving on headlines rather than scheduled data, gaps and slippage mean a Stop Loss can still execute at a materially worse price than the level set, particularly outside regular market hours.
Leverage in oil CFDs cuts both ways, and this kind of headline-driven volatility can shift margin requirements quickly in either direction. Position sizing relative to account equity is worth a second look while the Middle East conflict remains unresolved.

RISK WARNING: CFDs are complex financial instruments and carry a high risk of losing money rapidly due to leverage. You should ensure you fully understand the risks involved and carefully consider whether you can afford to take the high risk of losing your money before trading.
Disclaimer: The information is provided for educational purposes only and doesn’t take into account your personal objectives, financial circumstances, or needs. It does not constitute investment advice. We encourage you to seek independent advice if necessary. The information has not been prepared in accordance with legal requirements designed to promote the independence of investment research. No representation or warranty is given as to the accuracy or completeness of any information contained within. This material may contain historical or past performance figures and should not be relied on. Furthermore estimates, forward-looking statements, and forecasts cannot be guaranteed. The information on this site and the products and services offered are not intended for distribution to any person in any country or jurisdiction where such distribution or use would be contrary to local law or regulation.
References
[1] “Latest Oil Market News and Analysis for July 23 – Bloomberg” https://www.bloomberg.com/news/articles/2026-07-22/latest-oil-market-news-and-analysis-for-july-23 Accessed on 23 July 2026.
[2] “Oil Prices Rise as Hormuz Tanker Traffic Drops Again – IranWire” https://iranwire.com/en/features/155307-oil-prices-rise-as-hormuz-tanker-traffic-drops-again/ Accessed on 23 July 2026.
[3] “Oil Climbs Over 4% to Near Six-Week High as Conflict Threatens Key Oil Transit Routes – Reuters via Yahoo Finance” https://finance.yahoo.com/news/oil-prices-rise-slightly-us-002859952.html Accessed on 23 July 2026.
[4] “Oil Prices Rise to Five-Week High on US-Iran Attacks, Houthi Blockade Threat – CNBC” https://www.cnbc.com/2026/07/21/oil-prices-dip-as-mediation-efforts-offset-us-iran-strikes.html Accessed on 23 July 2026.
[5] “Crude Oil – Price – Chart – Historical Data – News – Trading Economics” https://tradingeconomics.com/commodity/crude-oil Accessed on 23 July 2026.
[6] “Weekly Petroleum Status Report – U.S. Energy Information Administration” https://www.eia.gov/petroleum/supply/weekly/ Accessed on 23 July 2026.
