


GDX vs GLD: Gold Miners Down 39% While GLD Held Firmer — What the Charts Show

Vantage Editorial Team >
Vantage Editorial Team >
Vantage is a global, multi-asset broker with a team of in-house writers and market analysts who produce educational and insightful trading content for traders of all levels.
 Updated Sat, 2026 July 18 01:00
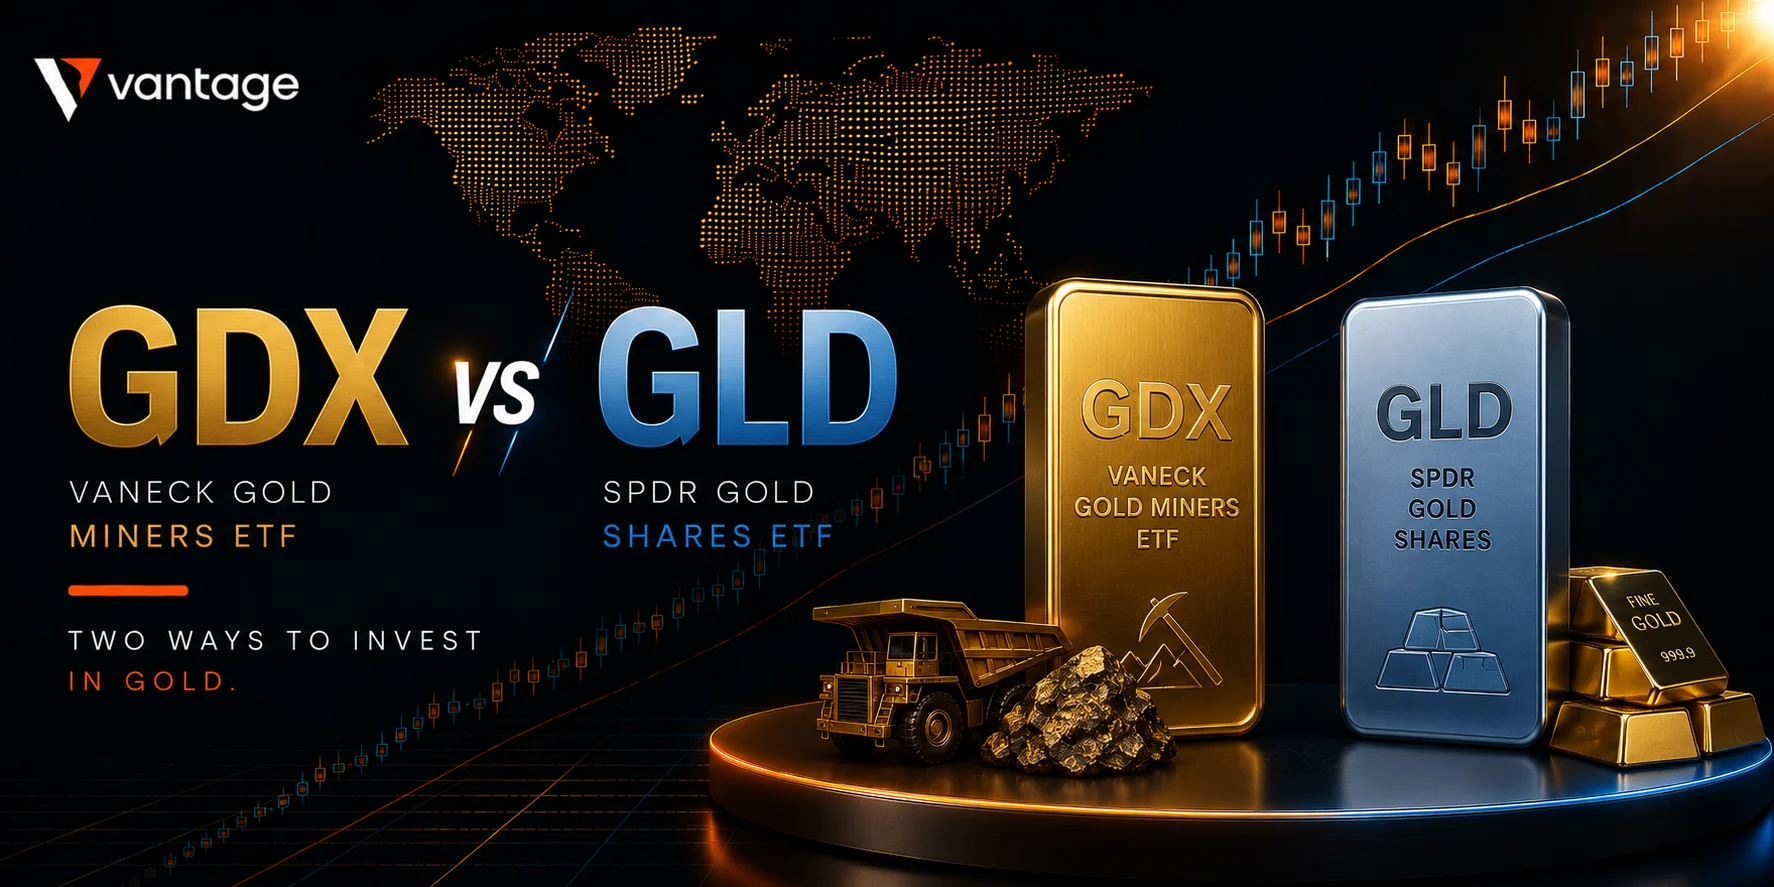
Gold has had a rough few months. But gold miners have had it worse. The VanEck Gold Miners ETF (GDX) closed at USD 71.43 on the Vantage platform as of 08:23 UTC (16:23 GMT+8) on 17 July 2026. The SPDR Gold Shares ETF (GLD) closed at USD 364.99 over the same session. Both are well below their early-year highs. The gap between them is the story.
From early April through early July, GLD fell roughly 12% as gold prices pulled back from their peak levels. Over the same window, GDX fell closer to 16%.1 Miners amplified the move on the way down, as they tend to do. The same operational leverage that drives miners to outperform gold in a rising market works in reverse when the metal corrects and cost pressures remain elevated.
This piece reads both charts and explains what is behind the divergence. All prices are as of 08:23 UTC (16:23 GMT+8), 17 July 2026, from the Vantage platform. Chart data is from TradingView. This is not financial advice.
Key points
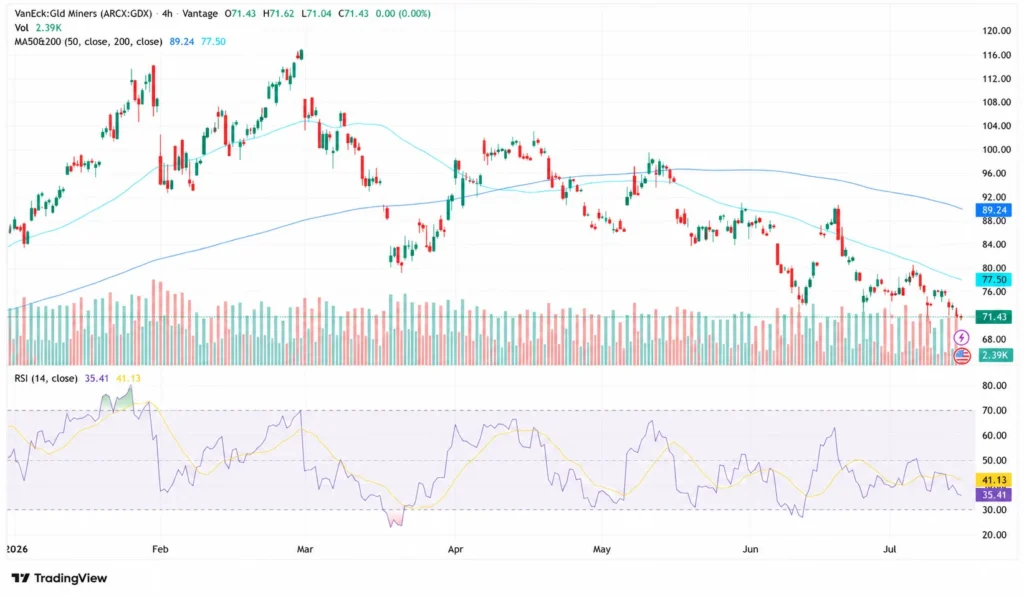
- GDX traded at USD 71.43 as of 08:23 UTC (16:23 GMT+8) on 17 July 2026, below both the 4H 50-period MA at USD 89.24 and the 4H 200-period MA at USD 77.50. RSI on the TradingView setup used for this analysis sat at 35.41, approaching oversold territory.
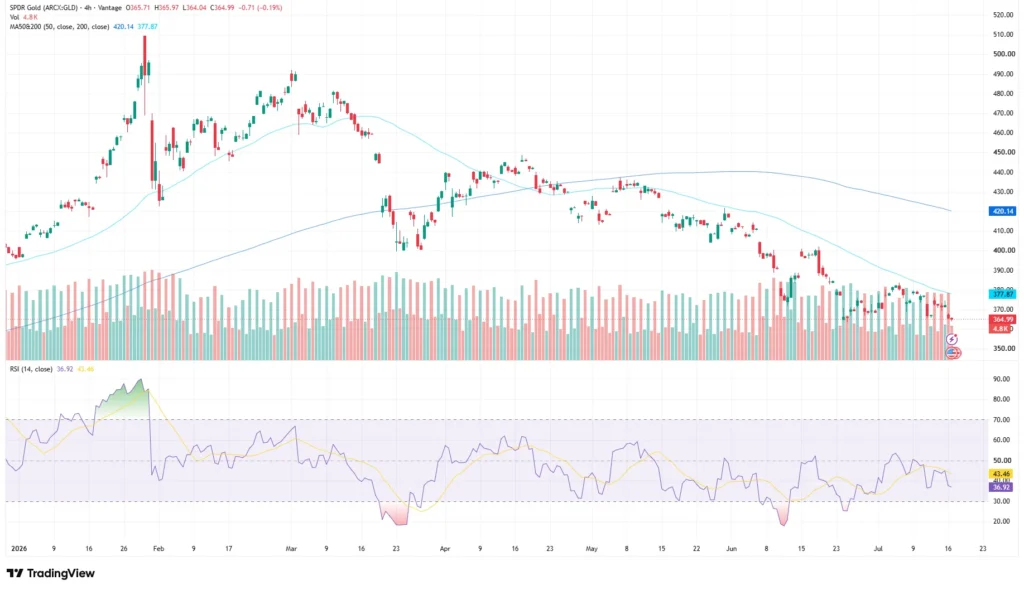
- GLD traded at USD 364.99 over the same session, also below both moving averages: the 4H 50-period MA at USD 420.14 and the 4H 200-period MA at USD 377.87. RSI at 36.92.
- The divergence between the two is not a chart anomaly. It reflects the operating leverage embedded in mining equities, and the cost inflation that has squeezed that leverage on the way down. Jefferies warned in June 2026 that sustained oil prices of USD 90–100 per barrel could add 5% to 9% to sector-wide all-in sustaining costs.
What the GDX chart is showing
GDX reached its 52-week high of USD 117.18 on 2 March 2026 and has been in a sustained decline since. As of 17 July 2026, the ETF is trading at USD 71.43, down approximately 39% from that peak. The 4H chart shows a series of lower highs and lower lows since March, with no sign yet of the structure breaking.
Both moving averages visible in the TradingView setup used for this analysis are tracking above current price and declining. The 4H 50-period MA sits at USD 89.24, well above the current close. The 4H 200-period MA is at USD 77.50, itself acting as overhead resistance rather than support, given that price has been trading below it since mid-June.
RSI for GDX stands at 35.41 on the TradingView setup used for this analysis, with the moving-average overlay at 41.13. RSI has oscillated between roughly 30 and 70 throughout the year, reaching near-oversold levels on several occasions during the Q2 decline and recovering each time without recapturing the 50 midline on a sustained basis.
Volume in the Vantage CFD feed has been elevated on the down legs, consistent with distribution rather than a low-conviction drift.
What the GLD chart is showing
GLD reached an intraday high of USD 509.70 on 29 January 2026, driven by the January gold spike before retracing. The chart since then shows a slower and less aggressive decline than GDX, which is the key structural difference between the two instruments.
As of 17 July 2026, GLD is at USD 364.99. The 4H 50-period MA sits at USD 420.14 and the 4H 200-period MA at USD 377.87. Price broke below the 200-period MA in mid-June and has not reclaimed it. The pattern since the April rebound high is also one of lower highs, but the pace of deterioration has been more measured than in GDX.
RSI for GLD sits at 36.92 on the TradingView setup used for this analysis, with the moving-average overlay at 43.46. Like GDX, RSI has not broken cleanly into oversold territory and has not reclaimed 50 on any sustained basis since the April high. The June low saw RSI approach 20, the lowest reading on the visible chart, before recovering.
The milder RSI decline in GLD relative to GDX reflects the structural difference: spot gold corrects more slowly than mining equities.
Why the gap exists: operational leverage in both directions

The GDX vs GLD divergence is not new. It is the standard behaviour of gold mining equities relative to spot gold, and understanding the mechanism matters for traders who access both instruments.
Gold miners carry what analysts call operating leverage. A miner’s all-in sustaining cost (AISC), the full cost of keeping a mine running, is largely fixed in the short term. When gold prices rise, incremental revenue flows almost entirely to the bottom line, which can cause miner earnings to grow much faster than the gold price itself. The reverse is also true: when gold prices fall or costs rise, the margin compression is amplified. A 1% decline in gold can translate into a 2% to 4% decline in major mining ETFs, depending on how tightly the sector is running its cost base.3
In 2026, that cost pressure has been significant. Jefferies, in a June 2026 research note, estimated that sustained oil prices of USD 90–100 per barrel could add 5% to 9% above original 2026 budgets to sector-wide AISC, equivalent to a range of USD 85 to USD 160 per ounce. Open-pit operations are particularly exposed because they consume larger quantities of diesel, explosives, and other energy-linked consumables. Consumables inflation typically lags oil by one to two quarters, which Jefferies flagged as making the second half of 2026 the key cost risk window.2
Gold Fields reported Q1 2026 AISC of USD 1,829 per ounce, a 13% year-on-year increase, driven by energy inflation and higher royalties at elevated gold prices.4
The Seeking Alpha analysis of Q2 2026 captures the net result: GLD fell roughly 12% from early April through early July while GDX fell closer to 16% over the same window — operational leverage amplifying the move on the way down.1
Levels traders are watching
| Instrument | Support | Resistance | What the chart shows |
| GDX | ~68.00 | 77.50 (200-period MA) / 89.24 (50-period MA) | Sustained downtrend from March high of ~117; both MAs acting as overhead resistance; RSI 35.41 |
| GLD | ~355.00 | 377.87 (200-period MA) / 420.14 (50-period MA) | Slower decline; broke below 200-period MA mid-June; RSI 36.92; Jun low near 20 RSI was deepest reading |
| XAUUSD | ~3,800 / ~3,945 | ~4,060 / ~4,200 | Gold near ~3,977 on 17 Jul; inverse USD correlation in play; miners amplify any XAUUSD directional move |
Table 1: Key levels as of 08:23 UTC (16:23 GMT+8), 17 July 2026. Sources: Vantage platform, TradingView. Indicative only — not trade signals.
What to watch
Key events that could shift the GDX vs GLD gap:
- US CPI and PPI data (July prints): A higher print reinforces cost pressure on miners; a downside surprise could narrow the GDX vs GLD gap.
- Oil prices and Middle East developments: Energy cost is the primary AISC driver this cycle. Any easing of supply disruption reduces the cost overhang; escalation widens it.
- Q2 earnings season (major gold miners): Newmont reports 23 July, Agnico Eagle 29 July, and Barrick 10 August. Actual AISC versus guidance will show whether the cost fears priced into GDX are tracking ahead of or behind reality.
- GDX 200-period MA at USD 77.50: The first meaningful technical hurdle on the 4H gold miner ETF chart. A sustained close above it would be the first signal of a structural shift.
- GLD 200-period MA at USD 377.87: GLD broke below this level in mid-June. A recovery above it would be the equivalent signal for the physical gold proxy, and would typically precede any GDX recovery.
Risk considerations
Market participants who monitor gold miner ETF CFDs typically pay close attention to Stop Loss placement in the context of the instrument’s amplified daily range. GDX, by its nature, moves more sharply than the underlying gold price, on both sides. In the current environment, where cost data and oil prices can shift the sector’s outlook within a single session, the gap between a defined risk level and its account impact can close quickly.
Traders holding positions across gold and gold miner instruments simultaneously should assess their total correlated exposure, a move in gold prices is typically amplified in GDX. The structural differences between physical gold ETFs and gold mining ETFs are covered in detail in the Vantage Academy.
Leverage amplifies both favourable and unfavourable outcomes. In instruments where the underlying already carries operational leverage, as gold miners do, CFD leverage adds a further multiplier to any gold price move. Revisiting position sizing relative to total account equity, rather than the margin required to open the trade, is a practical step before entering any gold miner ETF CFD position. Market participants often reassess sizing assumptions when gold sector volatility is elevated, as it has been throughout Q2 and into July 2026.
RISK WARNING: CFDs are complex financial instruments and carry a high risk of losing money rapidly due to leverage. You should ensure you fully understand the risks involved and carefully consider whether you can afford to take the high risk of losing your money before trading.
Disclaimer: The information is provided for educational purposes only and doesn’t take into account your personal objectives, financial circumstances, or needs. It does not constitute investment advice. We encourage you to seek independent advice if necessary. The information has not been prepared in accordance with legal requirements designed to promote the independence of investment research. No representation or warranty is given as to the accuracy or completeness of any information contained within. This material may contain historical or past performance figures and should not be relied on. Furthermore estimates, forward-looking statements, and forecasts cannot be guaranteed. The information on this site and the products and services offered are not intended for distribution to any person in any country or jurisdiction where such distribution or use would be contrary to local law or regulation.
References
[1] “Gold Just Had Its Worst Quarter in 13 Years, and GDX Might Be the Contrarian Rebound Nobody’s Talking About — Yahoo Finance” https://finance.yahoo.com/markets/commodities/articles/gold-just-had-worst-quarter-185538942.html Accessed on 17 July 2026.
[2] “Oil boosts risk of gold miner cost revisions: Jefferies — The Northern Miner” https://www.northernminer.com/news/oil-boosts-risk-of-gold-miner-cost-revisions-jefferies/1003891889/ Accessed on 17 July 2026.
[3] “GDX: Making Sense Of Gold Miners’ Lagging Performance — Seeking Alpha” https://seekingalpha.com/article/4907682-gdx-making-sense-of-gold-miners-lagging-performance Accessed on 17 July 2026.
[4] “Gold Fields War Inflation Costs in 2026: Margin Pressure Builds — Discovery Alert” https://discoveryalert.com.au/gold-fields-war-inflation-costs-mining-margins-2026/ Accessed on 17 July 2026.
[5] “Gold ETFs vs. Gold Mining ETFs: How Do They Compare in 2026? — Vantage Markets” https://www.vantagemarkets.com/en/academy/gold-etfs-vs-gold-mining-etfs/ Accessed on 17 July 2026.
[6] “Copper and Gold Market Outlook 2026: Prices, Supply and Mining Costs — S&P Global” https://www.spglobal.com/market-intelligence/en/news-insights/research/2026/04/copper-gold-market-outlook-2026-prices-supply-mining-costs Accessed on 17 July 2026.
[7] “Gold — Monthly Report July 2026 — Stock Market Watch” https://stockmarketwatch.com/metal/gold/reports/july-2026 Accessed on 17 July 2026.
[8] “Best Gold ETFs for Global Investors — Vantage Markets” https://www.vantagemarkets.com/en/academy/best-gold-etfs/ Accessed on 17 July 2026.
[9] “AISC Trends Gold Mining 2026 — Skillings Mining Review” https://skillings.net/aisc-trends-gold-mining-2026-the-ultimate-guide-to-succeeding-in-a-high-cost-market/ Accessed on 17 July 2026.
