


[DAILY TRADING] Crude Oil Price Today, 9 July 2026 – Brent Near $79, WTI Above $74 as Hormuz Risk Returns

Vantage Editorial Team >
Vantage Editorial Team >
Vantage is a global, multi-asset broker with a team of in-house writers and market analysts who produce educational and insightful trading content for traders of all levels.
 Updated Thu, 2026 July 9 05:37
![[DAILY TRADING] Crude Oil Price Today, 9 July 2026 – Brent Near $79, WTI Above $74 as Hormuz Risk Returns](https://www.vantagemarkets.com/wp-content/uploads/2026/06/UKOUSD_USOUSD_banner_900x430_optimized-1.webp)
Crude oil prices today are holding close to this week’s highs after a volatile stretch driven by renewed conflict in the Middle East. As of 02:47 UTC (10:47, GMT+8) on 9 July 2026, based on the Vantage UKOUSD CFD and Vantage USOUSD CFD feeds, the Brent crude oil price traded at 78.804, up 0.06% on the session, while the WTI crude oil price sat at 74.678, up 0.09%. Both benchmarks jumped sharply this week after the United States carried out fresh strikes on Iran and withdrew a waiver that had allowed Tehran to sell oil, reigniting concerns over shipping through the Strait of Hormuz just as flows had started to normalise.1,2
Here’s today’s crude oil news, the oil price chart for both instruments, and the levels currently in view.
Key Points
- The Brent crude oil price (UKOUSD) traded near 78.80 and the WTI crude oil price (USOUSD) near 74.68 as of the 9 July 2026 cut-off, both still elevated after a week of Middle East-driven strikes.
- Fresh US strikes on Iran and a revoked sanctions waiver on Iranian oil sales pushed both benchmarks toward two-week highs before a modest pullback from the peaks.1,3
- Both charts show price above their 50- and 200-period moving averages, with RSI readings in the mid-50s on the TradingView setup used for this analysis, in neutral-to-firm territory rather than at an extreme.
Today’s oil price charts: what they are showing
WTI Crude Oil Price (USOUSD)
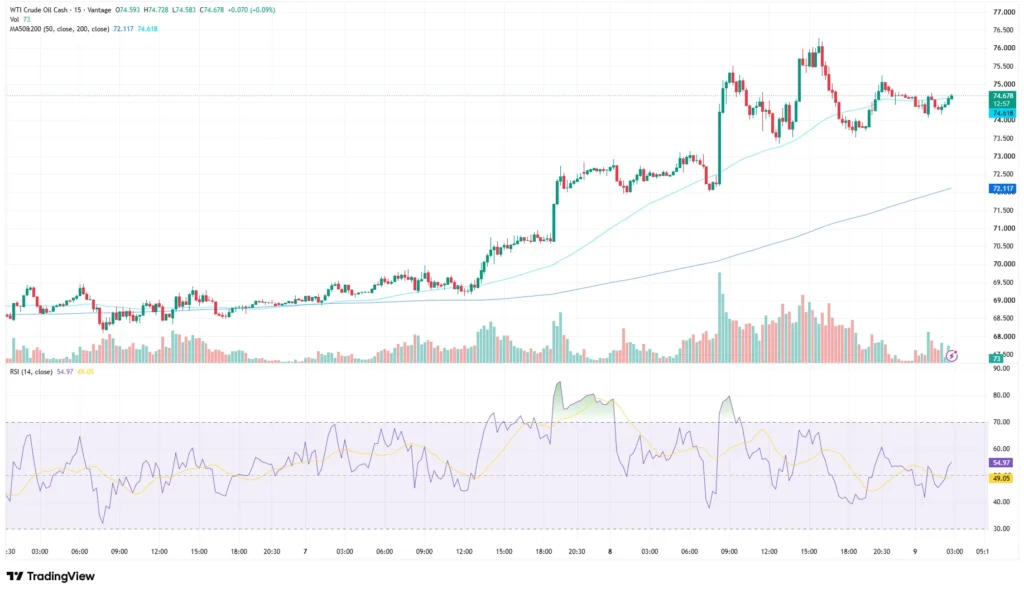
The Vantage USOUSD CFD chart shows the WTI crude oil price opened at 74.593, ranged between 74.583 and 74.728, and last traded at 74.678. Tick volume measured 73 on the TradingView CFD feed for this candle. Price has climbed steadily this week, clearing a 72.00 to 73.00 consolidation band before extending toward a high near 76.00 and then easing back. The 50-period moving average reads 72.117 and the 200-period average reads 74.618. The RSI (14, close) on the TradingView setup used for this analysis stands at 54.97, signal line 49.05, in the upper half of neutral territory.
Brent Crude Oil Price (UKOUSD)
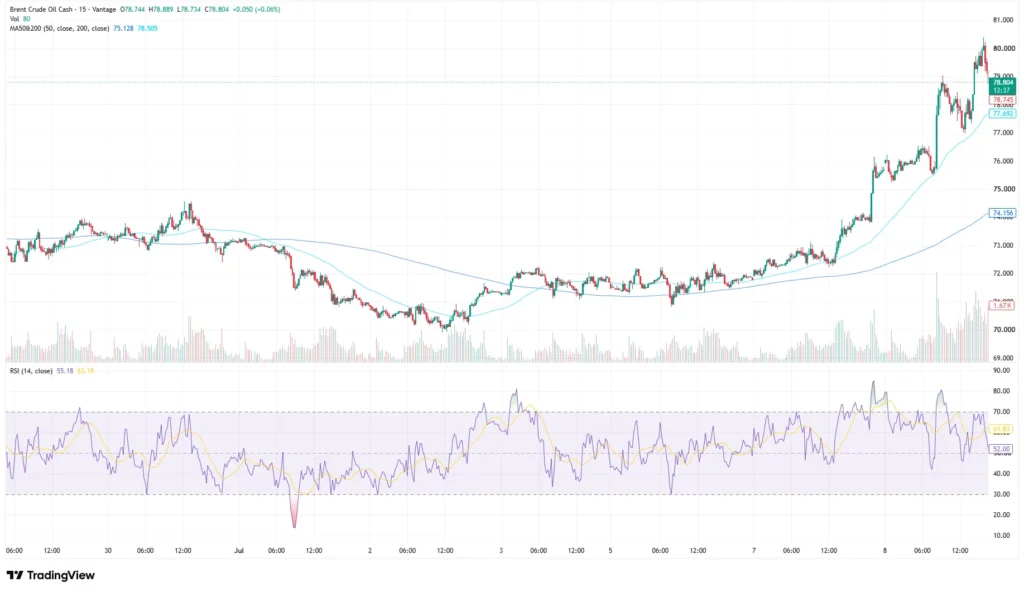
Brent crude oil’s price action on the Vantage UKOUSD CFD chart tells a similar story, with a sharper move behind it. The pair opened at 78.744, ranged from 78.734 to 78.889, and last traded at 78.804. Tick volume measured 80 on the TradingView CFD feed for this candle. Brent slipped to a multi-week low in late June before staging a sharp recovery, briefly moving above 80.00 earlier this week before easing back into the high 78s.2,5 The 50-period moving average reads 75.128 and the 200-period average reads 78.505, both now below the current price. The RSI (14, close) stands at 52.00, signal line 61.83, again neutral-to-firm and not stretched.

Crude Oil News Today: What’s Driving the Move
The move traces back to the collapse of a fragile truce in the Middle East conflict. Iran struck commercial vessels transiting the Strait of Hormuz this week, and the United States responded on 8 July with additional strikes on Iranian targets, saying the aim was to keep the waterway open to traffic.1,3 Washington also withdrew a waiver that had let Iran sell oil under an interim arrangement, and Tehran said it had targeted US military sites in Bahrain and Kuwait in response.3,4 The Strait of Hormuz normally carries around one-fifth of global oil supplies, so renewed disruption there tends to show up quickly in the crude oil price.1
Speaking at a NATO summit in Turkey, President Trump said he considered the truce over but did not expect a return to full-scale conflict, adding he expects oil prices to fall as tankers resume moving through the strait.3 Separately, the latest EIA report showed a modest increase in commercial crude inventories, providing only limited offset to the geopolitical risk premium currently priced into both benchmarks.5,6
Levels to watch and risk considerations
The table below covers the zones market participants are monitoring on both contracts. These are reference levels drawn from the charts above, not trade signals.
| Instrument | Support | Resistance | What’s happening |
| UKOUSD (Brent) | 77.00 | 80.00 | Holding a pullback after briefly clearing 80.00 this week |
| USOUSD (WTI) | 72.00 | 76.00 | Consolidating below this week’s high after the latest leg higher |
Table 1: Key levels as of 02:47 UTC (10:47, GMT+8), 9 July 2026. Sources: Vantage CFD feed, TradingView, Bloomberg2, Reuters1. Indicative only.
What to watch next: any further exchanges between the US and Iran around the Strait of Hormuz, the next EIA weekly inventory report, and OPEC+ commentary on output levels.
Given how quickly this market has moved on Middle East headlines, standard intraday ranges are less reliable right now for both UKOUSD and USOUSD. Market participants often monitor the 72.00 and 76.00 zones on WTI, and the 77.00 and 80.00 zones on Brent, as technical reference points, alongside a Stop Loss discipline sized to the account rather than to the headline of the moment.
Leverage is available on both UKOUSD and USOUSD CFDs and works in both directions, magnifying gains and losses alike, so position sizing relative to account equity is worth revisiting ahead of further Hormuz developments. This analysis is observational and does not constitute a recommendation to open or close a position.

RISK WARNING: CFDs are complex financial instruments and carry a high risk of losing money rapidly due to leverage. You should ensure you fully understand the risks involved and carefully consider whether you can afford to take the high risk of losing your money before trading.
Disclaimer: The information is provided for educational purposes only and doesn’t take into account your personal objectives, financial circumstances, or needs. It does not constitute investment advice. We encourage you to seek independent advice if necessary. The information has not been prepared in accordance with legal requirements designed to promote the independence of investment research. No representation or warranty is given as to the accuracy or completeness of any information contained within. This material may contain historical or past performance figures and should not be relied on. Furthermore estimates, forward-looking statements, and forecasts cannot be guaranteed. The information on this site and the products and services offered are not intended for distribution to any person in any country or jurisdiction where such distribution or use would be contrary to local law or regulation.
References
[1] “Oil rises after US launches fresh strikes against Iran – Reuters” https://finance.yahoo.com/news/oil-rises-us-launches-fresh-010522978.html Accessed on 9 July 2026.
[2] “Oil Extends Surge as Fresh US Strikes Against Iran Rattle Market – Bloomberg” https://www.bloomberg.com/news/articles/2026-07-08/latest-oil-market-news-and-analysis-for-july-9 Accessed on 9 July 2026.
[3] “Oil prices today: Brent, WTI rise as US targets Iran – CNBC” https://www.cnbc.com/2026/07/08/oil-prices-brent-wti-iran-us-hormuz.html Accessed on 9 July 2026.
[4] “Oil rises more than a dollar per barrel as US launches fresh strikes against Iran – Reuters via Investing.com” https://www.investing.com/news/commodities-news/oil-rises-more-than-a-dollar-per-barrel-as-us-launches-fresh-strikes-against-iran-4782740 Accessed on 9 July 2026.
[5] “Oil Surges on Renewed Iran Strikes – Rigzone” https://www.rigzone.com/news/wire/oil_surges_on_renewed_iran_strikes-08-jul-2026-184093-article/ Accessed on 9 July 2026.
[6] “Weekly Petroleum Status Report – U.S. Energy Information Administration” https://www.eia.gov/petroleum/supply/weekly/ Accessed on 9 July 2026.
[7] “Brent Crude Oil Futures Price Today – Investing.com” https://www.investing.com/commodities/brent-oil Accessed on 9 July 2026.
[8] “Crude Oil Price Today: July 7, 2026 – Forbes Advisor” https://www.forbes.com/advisor/investing/oil-prices-today/ Accessed on 9 July 2026.
