XAUUSD Price Today: Gold Jumps to $4,181 as Fed Odds Slide
Vantage Editorial Team >
Vantage Editorial Team >
Vantage is a global, multi-asset broker with a team of in-house writers and market analysts who produce educational and insightful trading content for traders of all levels.
The XAUUSD price traded near $4,181 per troy ounce as of 09:50 (GMT+8) / 01:50 UTC on 3 July 2026, up around 1.38% on the four-hour session covered by the chart below. Gold price today sits well off the eight-month low it touched under $4,000 just last month.
That rebound follows one of gold’s roughest stretches in recent memory. The metal touched an eight-month low below $4,000 in late June 2026, a drawdown of roughly 25% from the record high above $5,595 set in late January 2026.[6]
The main catalyst for this week’s rebound, and the top gold price news story, was a weaker-than-expected US jobs report that pulled some of the hawkish pressure back out of the market, sending gold back toward the middle of its recent trading range. Check out the latest gold price news here.
This piece works through the latest XAUUSD news, what the chart is showing, the three forces behind this week’s price action, and the levels traders are watching into the next round of US data. All levels are as of 09:50 (GMT+8) / 01:50 UTC, 3 July 2026, unless stated otherwise. Charts are indicative and sourced from TradingView. This is not financial advice.
Key Points
- XAUUSD traded near $4,181 as of 3 July 2026, rebounding off an eight-month low below $4,000 after a weaker-than-expected June jobs report pulled back rate-hike expectations.
- The Fed held rates at 3.50% to 3.75% on 17 June, but nine of 18 policymakers pencilled in a 2026 rate hike, a hawkish dot-plot shift under new Chair Kevin Warsh.
- June nonfarm payrolls rose by just 57,000 against a consensus of around 110,000, and the unemployment rate eased to 4.2%, leading markets to reduce expectations for a September rate hike and lifting gold prices.
What the XAUUSD chart is showing
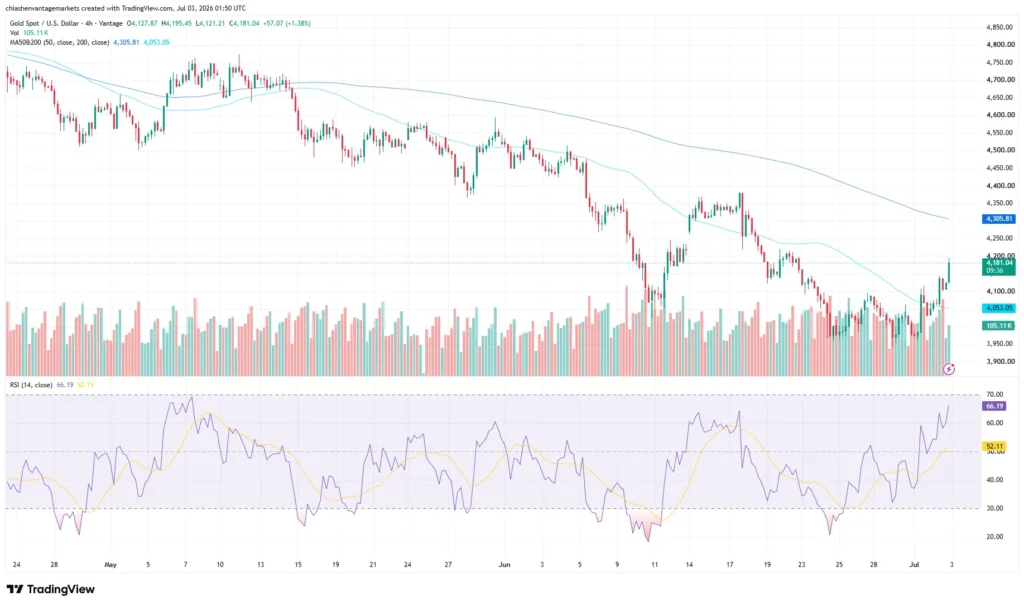
This XAUUSD technical analysis reads the 4H XAUUSD TradingView chart. Price opened the session at $4,127.87, ranged between $4,121.21 and $4,195.45, and closed near $4,181.04, a gain of roughly 1.38% on the period.
The broader structure on this timeframe has been a decline. From late April through mid-June, gold prices moved lower in a series of lower highs, falling from the $4,700 area toward the low $3,900s before the latest rebound. The 50-period moving average sits at $4,305.81 and has been sloping lower since May, sitting well above the current price and acting as a well-defined overhead reference. The 200-period moving average sits at $4,053.05, below the current price, and price spent much of June testing that zone from above.
The RSI on the TradingView setup used for this analysis reads 66.19, having crossed back above its own moving average at 52.11 during the latest rebound. That is the first push toward the upper half of the RSI range since mid-June’s oversold conditions, though the reading remains short of the 70 threshold typically associated with overbought conditions. Trading volume on the rebound leg has been broadly in line with the average over the past month, based on the volume histogram on the chart.
The three things driving gold prices right now

A jobs report that reset rate-hike bets
US nonfarm payrolls rose by 57,000 in June, well below the roughly 110,000 consensus and the slowest pace of job growth in four months.[1],[7] The unemployment rate eased to 4.2%, though the move was driven largely by a decline in the labour force participation rate to 61.5%, rather than by a pickup in hiring.[1]
Markets reduced expectations for a September rate hike following the weaker jobs report. Fed funds futures priced materially lower odds of a hike than they had ahead of the release.[2] For a non-yielding asset such as gold, that repricing lower in near-term rate-hike odds coincided with the metal’s climb back above $4,100.[2]
The most hawkish Fed meeting of Kevin Warsh’s tenure so far
The Federal Reserve held its benchmark rate at 3.50% to 3.75% at its 17 June meeting, the first chaired by Kevin Warsh.[3] The decision itself was unanimous, but the accompanying projections told a different story: nine of 18 policymakers pencilled in at least one rate hike by the end of 2026, and the median dot moved to 3.8%, up from 3.4% in March.[3]
That hawkish shift, alongside forecasts for firmer year-end inflation, is part of what pushed rate-hike pricing to the elevated levels the June jobs data has since partially unwound.4 Markets are pricing a data-dependent path rather than following the June projections in a straight line.
A fading risk premium from the Middle East conflict
Gold benefited earlier this year from the Middle East conflict, which lifted oil prices and safe-haven demand. That premium has been unwinding. Commercial shipping through the Strait of Hormuz has continued to recover alongside progress in US-Iran talks, and oil prices have moved lower as a result.
A smaller energy-driven inflation risk removes one of the arguments for further tightening, working in the same direction as the softer jobs data.[2] A renewed escalation, or a breakdown in talks, would work the other way.
Levels to watch
The table below covers the reference levels traders are watching around the current XAUUSD range. These are observational levels, not trade signals.
| Level | Price | What’s Happening |
| 200-period MA (4H) | $4,053.05 | Recent range floor; price tested this zone from above through most of June |
| Round-number support | $4,000.00 | Psychological level; XAUUSD dipped below this for the first time since November 2025 in late June |
| Current price (cut-off) | $4,181.04 | As of 09:50 (GMT+8) / 01:50 UTC, 3 July 2026 |
| Round-number resistance | $4,200.00 | Near-term level inside the current session’s range |
| 50-period MA (4H) | $4,305.81 | Declining since May; sits above the current price |
Table 1: Key levels as of 09:50 (GMT+8) / 01:50 UTC, 3 July 2026. Sources: TradingView, Vantage XAUUSD CFD, Reuters via TradingEconomics.2
A few things worth noting. The zone between the 200-period moving average and the round $4,000 handle has been the main contested area since June, and price spent several sessions on either side of it before the latest bounce.[5] On the upside, the 50-period moving average has capped every recovery attempt on this timeframe since early May, and its downward slope means the level itself keeps drifting lower over time.
For broader context, Goldman Sachs’ year-end 2026 gold forecast currently sits at $4,900, revised down from $5,400 on 19 June, two days after the Fed’s hawkish June meeting, as the bank no longer expects a 2026 rate cut.[8] The bank still points to structural central bank diversification as a longer-term support for gold.5 These are third-party forecasts, not a Vantage view, and they illustrate how bank outlooks continue to shift alongside the Fed’s own projections.
Market participants often monitor the $4,000 region and the 200-period moving average as key technical reference zones, particularly during periods of elevated volatility.
What to watch this week and beyond
For the latest gold news and catalysts that could move XAUUSD, keep an eye on the following:
- FOMC Minutes (June meeting), mid-July 2026: The full record of the nine-of-18 hike projections and how divided the committee actually was behind closed doors.
- ISM Services PMI, 3 July 2026: A read on the services side of the economy that sits alongside the weaker June payrolls print.
- Fed Chair Warsh public remarks, ongoing: Any follow-up commentary on the moderating inflation expectations he flagged this week.
- US-Iran talks and Strait of Hormuz shipping data, ongoing: Further easing would remove more of the risk premium; a setback would work the other way.
- Next Non-Farm Payrolls report, August 2026: The next major data point for gauging whether June’s slowdown was a one-off or the start of a trend.
Risk management and overall exposure are often reviewed ahead of major US data releases, given how much of the past month’s price action has clustered around the $4,000 to $4,053 zone. Gold’s own historical volatility, and its correlation with the dollar and Treasury yields, means moves can extend quickly once a level such as the 200-period moving average gives way.
Leverage works both ways in a market this sensitive to data surprises, and position sizing proportional to account equity remains one of the more consistent ways traders manage that exposure. This is particularly relevant for XAUUSD, where four-hour ranges of $50 to $70 have been common through the recent volatility.
RISK WARNING: CFDs are complex financial instruments and carry a high risk of losing money rapidly due to leverage. You should ensure you fully understand the risks involved and carefully consider whether you can afford to take the high risk of losing your money before trading.
Disclaimer: The information is provided for educational purposes only and doesn’t take into account your personal objectives, financial circumstances, or needs. It does not constitute investment advice. We encourage you to seek independent advice if necessary. The information has not been prepared in accordance with legal requirements designed to promote the independence of investment research. No representation or warranty is given as to the accuracy or completeness of any information contained within. This material may contain historical or past performance figures and should not be relied on. Furthermore estimates, forward-looking statements, and forecasts cannot be guaranteed. The information on this site and the products and services offered are not intended for distribution to any person in any country or jurisdiction where such distribution or use would be contrary to local law or regulation.
References
[1] “The Employment Situation – June 2026 – U.S. Bureau of Labor Statistics” https://www.bls.gov/news.release/empsit.nr0.htm Accessed on 3 July 2026.
[2] “Gold – Price – Chart – Historical Data – News – Trading Economics” https://tradingeconomics.com/commodity/gold Accessed on 3 July 2026.
[3] “June FOMC: Fed holds interest rates steady as Warsh era begins – Fox Business” https://www.foxbusiness.com/economy/federal-reserve-interest-rate-decision-june-17-2026 Accessed on 3 July 2026.
[4] “Fed interest rate decision June 2026: Fed holds rates steady – CNBC” https://www.cnbc.com/2026/06/17/fed-interest-rate-decision-june-2026.html Accessed on 3 July 2026.
[5] “Gold price selloff explained: Why investors are pulling back – Investing.com” https://www.investing.com/news/commodities-news/gold-price-selloff-explained-why-investors-are-pulling-back-4767189 Accessed on 3 July 2026.
[6] “Gold Mid-Year Outlook 2026: Point break – World Gold Council” https://www.gold.org/goldhub/research/gold-mid-year-outlook-2026 Accessed on 3 July 2026.
[7] “U.S. job creation cools in June with payrolls growth of just 57,000; unemployment rate at 4.2% – CNBC” https://www.cnbc.com/2026/07/02/jobs-report-june-2026-.html Accessed on 3 July 2026.
[8] “Goldman Sachs Lops $500 Off Gold Target on No Fed Cuts This Year – Bloomberg” https://www.bloomberg.com/news/articles/2026-06-19/goldman-sachs-lops-500-off-gold-target-on-no-fed-cuts-this-year Accessed on 3 July 2026.
