USDX at 99: Dollar Chart, Levels and FOMC Outlook
Vantage Editorial Team >
Vantage Editorial Team >
Vantage is a global, multi-asset broker with a team of in-house writers and market analysts who produce educational and insightful trading content for traders of all levels.
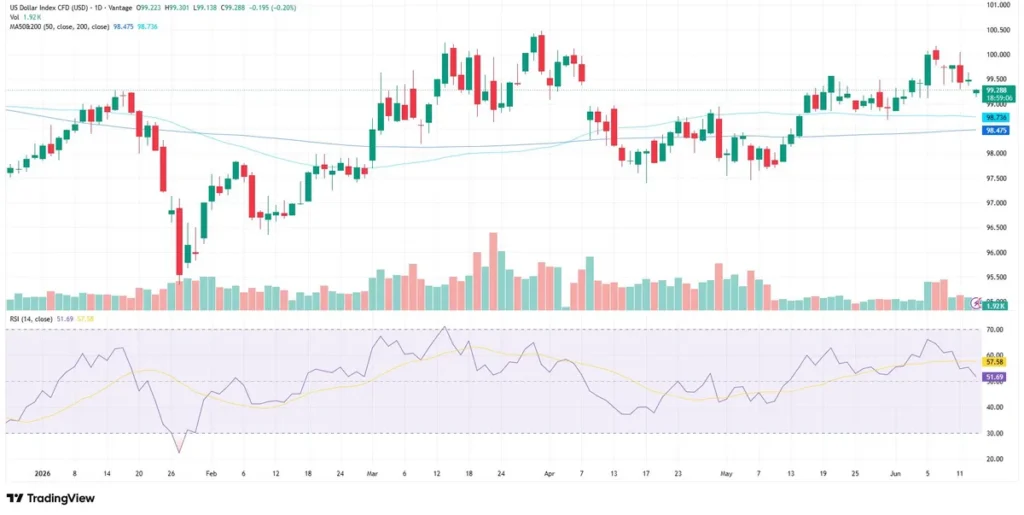
The US dollar index (USDX) is at 99.29 as of 15 June 2026, 02:00 UTC (10:00 GMT+8), per the Vantage USDX CFD. That puts it above both the D1 50-period MA at 98.48 and the D1 200-period MA at 98.74, but the RSI at 51.69 per the TradingView setup used for this analysis sits in neutral territory.
Three events now converge. May CPI printed at 4.2% year-on-year on 10 June, the highest since April 2023.[1] The ECB raised rates 25 basis points to 2.25% on 11 June, its first hike since 2023.[2],[9] And the FOMC meeting on 16 to 17 June carries an updated dot plot and is the highest-impact event for dollar pairs this week. Charts are from TradingView. This is not financial advice.
Key points
- The USDX us dollar index chart shows the index at 99.29, above both MAs. The RSI per the TradingView setup used for this analysis reads 51.69 as neutral, not extended.
- May CPI came in at 4.2% year-on-year, driven by a 23.5% jump in energy prices. Core CPI rose 0.2% month-on-month, in line with forecasts and below the headline number.[1]
- Markets are pricing a near-certain probability that rates remain unchanged at the June FOMC. The dot plot and the press conference tone are the variables most likely to move the dollar index this week.
What the US dollar index chart is showing
The Vantage USDX CFD D1 chart shows the index bottoming near 95.50 in late January, recovering through both MAs, and briefly testing 100.50 in March. Since then, the dollar has pulled back and consolidated.
The D1 50-period MA (98.48) remains above the D1 200-period MA (98.74), maintaining a bullish longer-term MA structure. Price is currently sitting between that MA cluster and the 100.00 round-number resistance. The RSI signal line at 57.58 is above the current 51.69 reading, consistent with the recent pull-back from the March-April push, but no oversold signal is present.
Three things driving the dollar index this week
1. May CPI at 4.2% – the energy shock in the data
The Bureau of Labor Statistics released May CPI on 10 June. Headline inflation ran at 4.2% year-on-year, up from 3.8% in April, with energy prices up 23.5% over 12 months and 3.9% month-on-month, accounting for more than 60% of the monthly gain, according to BLS data.[1],[3]
Core CPI rose 0.2% month-on-month, in line with consensus. Core goods prices fell, suggesting tariff-related price pressures may be moderating. Morgan Stanley Wealth Management’s Ellen Zentner said the data gives the Fed room to remain patient.[4] For the US dollar index, that patience means no rate-cut catalyst and no rate-hike trigger, the same holding pattern that has defined the dollar index chart since March.
2. The June FOMC – dot plot over decision
Markets are pricing a near-certain probability that rates remain unchanged at the 3.50% to 3.75% target range at the 16 to 17 June FOMC.[5] J.P. Morgan Wealth Management confirmed the base case: rates on hold for 2026, with a likely shift away from any easing bias.[6]
The market-moving variable is the updated Summary of Economic Projections. Any dot plot shift toward neutral or higher would reprice leverage across dollar pairs quickly, leverage amplifies both gains and losses. Markets will also be watching whether the press conference tone signals any shift in policy communication.
3. ECB hike narrows the rate differential
The ECB raised its deposit facility rate to 2.25% on 11 June, citing Middle East conflict-driven inflation. Eurozone CPI stood at 3.2% in May.[2],[9] The euro makes up roughly 57% of the USDX basket, so a tighter ECB directly compresses the rate differential that has supported the dollar. EURUSD moved from around 1.1570 to 1.1600 after the decision, per the Vantage CFD feed.
Key levels on the dollar index chart
Reference levels across major USD pairs as of 15 June 2026, 02:00 UTC (10:00 GMT+8). Not trade signals.
| Pair | Support | Resistance | What is happening |
| USDX | 98.74 / 98.00 | 99.50 / 100.00 | Above both MAs; RSI 51.69 neutral; holding below 100 |
| EURUSD | 1.1500 / 1.1570 | 1.1650 / 1.1700 | ECB hike lifted euro; rate differential narrowing |
| USDJPY | 158.00 / 156.00 | 162.00 | BOJ meets 16 to 17 June concurrent with Fed; price above 160.00; intervention watch at 162.00 |
| XAUUSD | 4,370 / 4,200 | 4,530 / 4,660 | Near USD4,477; inverse dollar correlation active; geopolitical bid in play |
Table 1: Key levels as of 15 June 2026, 02:00 UTC (10:00 GMT+8). Sources: TradingView, Reuters, Bloomberg. Indicative only.
USDJPY is near 160.24, within the zone that drew intervention speculation earlier in 2026.[7] The Bank of Japan meets concurrently with the Fed. Any shift in Tokyo’s yield curve policy would add volatility to yen pairs immediately.
Gold (XAUUSD) is near $4,477 per Trading Economics data from early June.[8] The metal has moved inversely to the dollar index through much of 2026. A dollar pushes back above 100.00 would weigh on gold; any FOMC-driven dollar softness removes that pressure.
What to watch this week
- FOMC decision and dot plot, 17 June: Released at 14:00 Eastern Time (02:00 GMT+8 on 18 June). The rate hold is priced in. What is most likely to move the US dollar index is the median dot and the tone on rate direction from the press conference.
- Bank of Japan, 16 to 17 June: Concurrent with the Fed. USDJPY near 160.00. Any yield curve surprise from Tokyo crosses directly into dollar positioning.
- Middle East ceasefire developments: A credible deal would lower energy prices, ease CPI pressure, and revive Fed cut expectations, a combination that could weigh on the dollar index. Escalation runs the opposite direction.
- Bank of England, 18 June: UK inflation is at 3.3%, one day after the Fed. Further central bank divergence from the US adds to the rate differential pressure on the USDX.
Risk management into a stacked calendar
With the FOMC, BOJ, and BOE inside a 48-hour window, intraday range assumptions are less reliable than normal. Stop Loss placement relative to the 98.74 D1 50-period MA support and 100.00 resistance is where traders monitoring the dollar index are concentrating their risk controls. Correlated positions across gold, yen pairs, and short-dollar crosses warrant a combined exposure check, in a risk-off move these can gap in the same direction simultaneously.
Leverage amplifies both gains and losses. Reviewing position sizing relative to account equity ahead of the 17 June FOMC release is particularly relevant for traders holding overnight dollar positions into the decision.
RISK WARNING: CFDs are complex financial instruments and carry a high risk of losing money rapidly due to leverage. You should ensure you fully understand the risks involved and carefully consider whether you can afford to take the high risk of losing your money before trading.
Disclaimer: The information is provided for educational purposes only and doesn’t take into account your personal objectives, financial circumstances, or needs. It does not constitute investment advice. We encourage you to seek independent advice if necessary. The information has not been prepared in accordance with legal requirements designed to promote the independence of investment research. No representation or warranty is given as to the accuracy or completeness of any information contained within. This material may contain historical or past performance figures and should not be relied on. Furthermore estimates, forward-looking statements, and forecasts cannot be guaranteed. The information on this site and the products and services offered are not intended for distribution to any person in any country or jurisdiction where such distribution or use would be contrary to local law or regulation.
References
[1] “CPI inflation report May 2026: Prices rose 4.2% annually — CNBC” https://www.cnbc.com/2026/06/10/cpi-inflation-report-may-2026.html Accessed on 15 June 2026.
[2] “ECB hikes interest rates for first time since 2023 — CNBC” https://www.cnbc.com/2026/06/11/ecb-hikes-interest-rates.html Accessed on 15 June 2026.
[3] “Consumer Price Index May 2026 — Bureau of Labor Statistics” https://www.bls.gov/news.release/pdf/cpi.pdf Accessed on 15 June 2026.
[4] “May 2026 CPI BLS report: consumer prices rose last month — Fox Business” https://www.foxbusiness.com/economy/cpi-inflation-may-2026 Accessed on 15 June 2026.
[5] “Fed Interest Rate Decision June 2026 — Mitrade” https://www.mitrade.com/au/insights/others/cfd-trading/fed-interest-rate-decision-2026 Accessed on 15 June 2026.
[6] “FOMC Meeting: June 2026 Rate Decision Preview — Charles Schwab” https://www.schwab.com/learn/story/fomc-meeting Accessed on 15 June 2026.
[7] “USDX Rebounds as Dollar Finds Support After Sell-Off — VT Markets” https://www.vtmarkets.com/analysis/usdx-rebounds-as-dollar-finds-support-after-sell-off/ Accessed on 15 June 2026.
[8] “Gold spot price — Trading Economics” https://tradingeconomics.com/commodity/gold Accessed on 15 June 2026.
[9] “Monetary policy decisions June 2026 — European Central Bank” https://www.ecb.europa.eu//press/pr/date/2026/html/ecb.mp260611~4d41bd5e83.en.html Accessed on 15 June 2026.
