[DAILY TRADING] S&P 500 Analysis 12 June 2026 — 7,415 After Trump Pulls Back on Iran Strikes
Vantage Editorial Team >
Vantage Editorial Team >
Vantage is a global, multi-asset broker with a team of in-house writers and market analysts who produce educational and insightful trading content for traders of all levels.
![[DAILY TRADING] S&P 500 Analysis 12 June 2026 — 7,415 After Trump Pulls Back on Iran Strikes](https://www.vantagemarkets.com/wp-content/uploads/2026/06/SP500_banner_900x430_balanced_optimized-2.webp)
The S&P 500 recovered sharply on 11 June 2026 after President Trump cancelled planned strikes on Iran and told reporters a peace deal was imminent.[1] The Vantage SP500 CFD is holding near 7,415 as of 13:26 GMT+8 (05:26 UTC) on 12 June 2026, ending a three-day losing streak with a strong rebound session.[2] All prices refer to the Vantage SP500 CFD. This is not financial advice.
Key points
- The SP500 sits near 7,415, on the 4H 50-period MA (7,412), while the 4H 200-period MA (7,471) is the nearest overhead zone as of 13:26 GMT+8 on 12 June 2026.
- Thursday’s 1.75% S&P500 performance gain coincided with Trump calling off Iran strikes; the Dow added 930 points in the same session. [2]
- The RSI (14) on the TradingView setup used for this analysis reads 52.38 and remains above its signal line at 40.91, indicating improving momentum from the early-June lows.
What the chart is showing
The SP500 tradingview 4H chart shows three clear phases since early May. The index trended steadily higher along the rising 4H 200-period MA, reaching a peak just above 7,600 around 22 May. From 27 May into early June, the structure broke: price fell sharply through both MAs and hit a low around 7,225-7,250 during the peak of US-Iran escalation. Price has since recovered back above the 4H 50-period MA, where it sits as of 13:26 GMT+8 on 12 June 2026.
The RSI (14) on the TradingView setup used for this analysis is at 52.38, above its signal line at 40.91. The RSI recovered from near oversold territory (close to 30) during the early-June low. Volume on the Vantage CFD feed spiked during the sell-off and remains elevated.
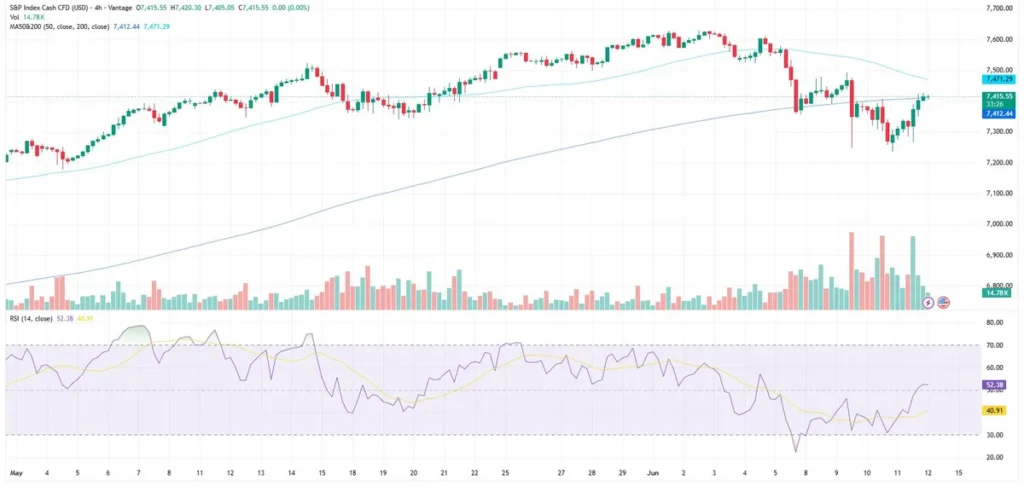
Levels to watch
The table below covers the zones on the s&p500 chart as of 13:26 GMT+8, 12 June 2026. These are reference levels, not trade signals.
| Level | Price (USD) | Type | Notes |
| Resistance 2 | 7,490 – 7,500 | Prior ceiling | Multiple tests in May; not reclaimed since June sell-off |
| Resistance 1 | 7,471 | 4H 200-period MA | Overhead; price below this MA since early June |
| Current price | ~7,415 | 4H 50-period MA | Sitting on this MA as of 13:26 GMT+8, 12 June 2026 |
| Support 1 | 7,257 – 7,290 | Swing low | Early-June spike-down floor |
Table 1: Key levels as of 13:26 GMT+8, 12 June 2026. Sources: Vantage SP500 CFD, TradingView. Indicative only.
The 7,490-7,500 zone is the most watched overhead cluster, it capped multiple rallies in May and the index has not closed above it since the June sell-off began. On the downside, 7,257-7,290 was the floor of the early-June drop: a return there from current levels would represent a decline of roughly 160 points.
What to watch this week and beyond
- Iran deal, ongoing: Trump stated documents were in final shape and a signing was imminent as of 11 June, with the US Naval blockade remaining in place until finalised.[1] Developments in negotiations may influence market sentiment and short-term SP500 stock price volatility.
- University of Michigan Consumer Sentiment, 12 June: Consumer confidence has been near multi-year lows amid energy price pressure.[3] A weak reading would add to the growth-concern backdrop already present in SP500 latest news flows.
- FOMC meeting, 16-17 June: With headline CPI above 4% and PPI at 3.9% year-on-year,[4] rate expectations remain an important focus for markets ahead of the June decision.
Risk considerations for S&P 500 CFD traders
The SP500 has shown pronounced sensitivity to geopolitical headlines in recent weeks. The index dropped more than 340 points in under two weeks during the early-June escalation, then recovered around 200 points in a single session as the tone shifted. Volatility may increase around major upcoming events, including developments in Iran negotiations and the FOMC meeting on 16-17 June.
Leverage in CFD trading works in both directions, amplifying both gains and losses relative to margin. Traders should be aware that swift, headline-driven moves, of the kind seen during the Iran escalation — can affect open CFD positions across correlated instruments.
RISK WARNING: CFDs are complex financial instruments and carry a high risk of losing money rapidly due to leverage. You should ensure you fully understand the risks involved and carefully consider whether you can afford to take the high risk of losing your money before trading.
Disclaimer: The information is provided for educational purposes only and does not take into account your personal objectives, financial circumstances, or needs. It does not constitute investment advice. We encourage you to seek independent advice if necessary. The information has not been prepared in accordance with legal requirements designed to promote the independence of investment research. No representation or warranty is given as to the accuracy or completeness of any information contained within. This material may contain historical or past performance figures and should not be relied on. Furthermore estimates, forward-looking statements, and forecasts cannot be guaranteed. The information on this site and the products and services offered are not intended for distribution to any person in any country or jurisdiction where such distribution or use would be contrary to local law or regulation.
References
[1] “Stock markets surge as Trump calls off strikes on Iran, touts peace deal – Al Jazeera” https://www.aljazeera.com/economy/2026/6/12/stocks-markets-surge-as-trump-calls-off-strikes-on-iran-touts-peace-deal Accessed on 12 June 2026.
[2] “US stocks closed sharply higher on Thursday – Trading Economics” https://tradingeconomics.com/united-states/stock-market Accessed on 12 June 2026.
[3] “Early Gains Linger Even as Wholesale Prices Surge – Schwab” https://www.schwab.com/learn/story/stock-market-update-open Accessed on 12 June 2026.
[4] “S&P 500 Index: Iran Threats, 4% Inflation and Chip Rout Sink Stocks – CNBC” https://www.cnbc.com/2026/06/09/stock-market-today-live-updates.html Accessed on 12 June 2026.
