[DAILY TRADING] US Dollar Index (USDX), 2 July 2026 – Holds Near 101.15 Ahead of June Payrolls
Vantage Editorial Team >
Vantage Editorial Team >
Vantage is a global, multi-asset broker with a team of in-house writers and market analysts who produce educational and insightful trading content for traders of all levels.
![[DAILY TRADING] US Dollar Index (USDX), 2 July 2026 – Holds Near 101.15 Ahead of June Payrolls](https://www.vantagemarkets.com/wp-content/uploads/2026/06/usdx_hero-1.webp)
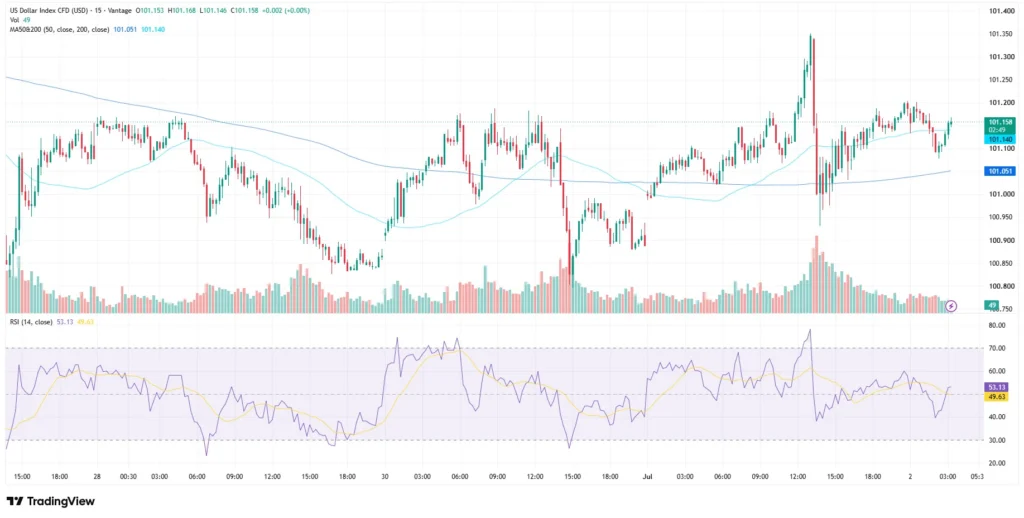
The Vantage US Dollar Index (USDX) CFD traded near 101.158 as of 02:49 (GMT+8) on 2 July 2026, above its 50-period moving average and testing its 200-period moving average after a volatile week that carried the index from a multi-week low to its highest print in over a year. Wednesday’s private payrolls data came in soft, yet the dollar barely moved.
This USDX analysis turns to the US June jobs report, due later Thursday, against Fed Chair Warsh’s Sintra comments, a yen at 40-year lows, and cooling Eurozone inflation. It reads the chart and calendar, not the next move. Check out the indices CFDs you can trade at Vantage Markets here.
Key Points
- The Vantage USDX CFD held near 101.158 as of 02:49 (GMT+8) on 2 July 2026, below Wednesday’s high after a sharp spike-and-pullback.
- June’s ADP private payrolls print rose by 98,000, below the 110,000 to 118,000 consensus range and down from 122,000 in May, though the dollar held its ground into Thursday’s non-farm payrolls release.[1]
- The US Dollar Index sits above its 50-period moving average (101.051) and is testing its 200-period moving average (101.140), with the RSI at 53.13, a modestly firm but non-directional reading.
What the USDX chart is showing
At the beginning of the period shown on the 15-minute USDX chart, the US Dollar Index CFD traded around 101.15 on 27 June, slipped to a low around 100.75 by 28 June, then recovered to a local high near 101.20 by 30 June before easing back toward 100.95.
The most notable move came on 1 July, when the index rallied sharply through London and US hours to print the week’s high near 101.35, only to reverse just as quickly on a single large pullback candle back toward 100.95. That spike-and-reversal, on the same day as the softer ADP print and Warsh’s Sintra remarks, suggests an initial reaction followed by rapid reassessment.
Since then, the index has settled into a narrower range around 101.10 to 101.20, where it remained as of the 02:49 (GMT+8) cut-off. The 50-period moving average, at 101.051, sits below current price, while the 200-period moving average, at 101.140, sits almost on top of the last traded level, with price testing that average rather than clearing it, consistent with stabilising rather than reversing lower. The RSI, on the TradingView setup used for this analysis, reads 53.13, close to neutral. See all latest USDX news here.
The three things driving the dollar this week

Warsh’s balance sheet message from Sintra
Fed Chair Kevin Warsh, speaking at the ECB’s Sintra forum on 1 July 2026, said any Fed balance sheet reduction would take years, not months, noting it took close to two decades to build.[2] His comments followed the June FOMC meeting, his first as chair, where the committee held rates at 3.50% to 3.75% and released a dot plot showing nine of 18 policymakers projecting a hike before year-end.[3] Markets generally interpreted the June 2026 dot plot as supportive of the dollar because it indicated that a majority of policymakers still expected at least one further rate increase during 2026.
A softer ADP print, a bigger test ahead
US private payrolls rose by 98,000 in June, according to ADP, below consensus and down from 122,000 in May, with education and health services accounting for close to half the gain.[1] The dollar showed little reaction, reflecting how the market has discounted ADP’s link to the official figures. The bigger event is the BLS June report, due at 08:30 (ET) on 2 July, with economists expecting payrolls near 115,000 and unemployment at 4.3%.[4]
Yen weakness and a steadier euro
The yen continued to underperform through the week, weakening past 162 per dollar to its lowest level since 1986, as the wide Fed-BOJ policy gap persisted alongside Japan’s reliance on Middle Eastern energy.[5] The euro, the largest weighting in the US Dollar Index basket, found some support from ECB President Christine Lagarde’s Sintra remarks, though softer Eurozone inflation later in the week reduced expectations for further ECB tightening.[6] With the yen weak and the euro mixed, the dollar index draws support from both sides of its basket.
Levels traders are watching
The table below covers US Dollar Index chart levels and USD pairs traders on MarketWatch and other platforms are watching. Reference only, not trade signals.
| Instrument | Support | Resistance | What’s happening |
| USDX (Vantage CFD) | 101.05 / 100.75 | 101.35 / 101.60* | Holding above both moving averages ahead of the jobs report |
| EURUSD | 1.1400 | 1.1500 | Range-bound between ECB messaging and Fed rate expectations |
| USDJPY | 161.50 | 162.70 (40-year high zone) | Yen under pressure, intervention watch building |
Levels reflect price action on the Vantage CFD feed as of 02:49 (GMT+8) on 2 July 2026. *101.60 is a higher-timeframe resistance level, not visible on the displayed 15-minute chart. †EURUSD and USDJPY levels are broader technical reference points, not derived from the chart shown. Indicative only.
What to watch this week and beyond
- US Non-Farm Payrolls, 2 July: Due at 08:30 (ET), June’s report is the next catalyst for USD pairs after a soft ADP print.
- US Unemployment Rate, 2 July: Released with payrolls; consensus looks for 4.3%.
- Fed Commentary, Ongoing: Further Fed remarks after Sintra could add colour to the rate-path debate.
- USDJPY Intervention Watch, Ongoing: Continued yen weakness keeps intervention in view.
The index has moved sharply in both directions this week, including the spike and reversal on 1 July 2026, a reminder that intraday ranges can widen quickly around scheduled data. Stop Loss placement near the moving-average zone (101.05 to 101.14) and recent extremes (100.75 and 101.35) is worth monitoring around a major release.
Leverage works both ways in this kind of headline-driven market, amplifying gains as much as losses. Position sizing relative to account equity is worth revisiting ahead of the payrolls release, especially for correlated USD positions.

RISK WARNING: CFDs are complex financial instruments and carry a high risk of losing money rapidly due to leverage. You should ensure you fully understand the risks involved and carefully consider whether you can afford to take the high risk of losing your money before trading.
Disclaimer: The information is provided for educational purposes only and doesn’t take into account your personal objectives, financial circumstances, or needs. It does not constitute investment advice. We encourage you to seek independent advice if necessary. The information has not been prepared in accordance with legal requirements designed to promote the independence of investment research. No representation or warranty is given as to the accuracy or completeness of any information contained within. This material may contain historical or past performance figures and should not be relied on. Furthermore estimates, forward-looking statements, and forecasts cannot be guaranteed. The information on this site and the products and services offered are not intended for distribution to any person in any country or jurisdiction where such distribution or use would be contrary to local law or regulation.
References
[1] “Private payrolls rose by 98,000 in June, less than expected, ADP reports – CNBC” https://www.cnbc.com/2026/07/01/private-payrolls-rose-by-98000-in-june-less-than-expected-adp-reports.html Accessed on 2 July 2026.
[2] “Warsh Says Fed Balance Sheet Reduction Will Take Years, Not Months – Bloomberg” https://www.bloomberg.com/news/articles/2026-07-01/warsh-signals-long-road-ahead-for-a-smaller-fed-balance-sheet Accessed on 2 July 2026.
[3] “Fed interest rate decision June 2026: Fed holds rates steady – CNBC” https://www.cnbc.com/2026/06/17/fed-interest-rate-decision-june-2026.html Accessed on 2 July 2026.
[4] “What to Expect From the June Jobs Report – Kiplinger” https://www.kiplinger.com/investing/economy/jobs-report-june-2026-what-to-expect Accessed on 2 July 2026.
[5] “Japanese Yen – Quote, Chart, Historical Data, News – Trading Economics” https://tradingeconomics.com/japan/currency Accessed on 2 July 2026.
[6] “EUR/USD, FTSE 100 Forecast: 2 Trades to Watch – Investing.com” https://www.investing.com/analysis/eurusd-ftse-100-forecast-2-trades-to-watch-200683128 Accessed on 2 July 2026.
