[DAILY TRADING] XAUUSD Analysis 1 July 2026 – Gold Price Holds Near $3,967 as Fed Hike Odds Climb to 67%
Vantage Editorial Team >
Vantage Editorial Team >
Vantage is a global, multi-asset broker with a team of in-house writers and market analysts who produce educational and insightful trading content for traders of all levels.
![[DAILY TRADING] XAUUSD Analysis 1 July 2026 – Gold Price Holds Near $3,967 as Fed Hike Odds Climb to 67%](https://www.vantagemarkets.com/wp-content/uploads/2026/06/XAUUSD_banner_900x430_optimized-3.webp)
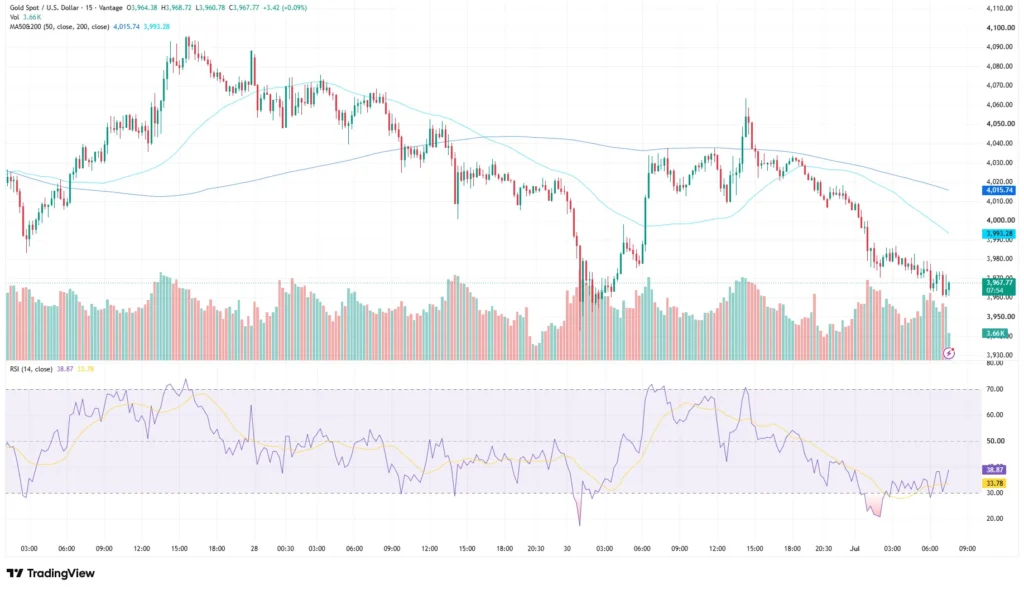
Spot gold (represented by the Vantage XAUUSD CFD) is trading near $3,967 per troy ounce as of 09:00 (GMT+8) on 1 July 2026, trading below both its 15-minute MA50 at $4,015.74 and MA200 at $3,993.28.
Gold has fallen roughly 11% over the past month as stronger US inflation data and rising expectations for another Federal Reserve rate hike lifted Treasury yields and pressured non-yielding assets[1], with JOLTS job openings unexpectedly rising to their highest level in around two years and May headline PCE reaching 4.1% year on year, while core PCE rose 3.4% year on year. Follow the latest gold news here.
All prices are as of 09:00 (GMT+8), 1 July 2026. Charts sourced from TradingView. This is not financial advice.
Key Points
- XAUUSD is trading near $3,967 as of 09:00 (GMT+8) on 1 July 2026, below the 15-min MA50 at $4,015.74 and MA200 at $3,993.28.
- Markets are pricing around a 67% chance of a September Fed rate hike following JOLTS job openings unexpectedly rising to their highest level in around two years and May headline PCE at 4.1% year on year.
- Gold is on track for a fourth consecutive monthly decline, with the RSI at 38.87 on the TradingView setup used for this analysis.
What the XAUUSD Chart Is Showing
On the 15-minute chart, gold peaked near $4,100 around 26 June before selling intensified into 28 June, pulling price down to around $3,960. A recovery attempt on 30 June pushed the Vantage XAUUSD CFD back toward $4,065, but sellers returned and price is now trading back near the session low, below both the MA50 at $4,015.74 and the MA200 at $3,993.28. Both moving averages are in a declining configuration over the period shown.
The RSI (14, close) on the TradingView setup used for this analysis reads 38.87, with the RSI moving-average overlay at 33.78. Both are in the lower half of the range and tracking downward since the 30 June recovery faded. Not yet at a classically oversold extreme, which means the shorter-timeframe selloff has not fully exhausted itself.
The Macro Backdrop Driving Gold News Today

Three data points are driving the gold price story. JOLTS job openings unexpectedly rose to their highest level in around two years this week,[2] May headline PCE came in at 4.1% year on year (the highest since April 2023) with core PCE at 3.4%,[3] and the CME FedWatch Tool now shows traders pricing around a 67% probability of a September rate hike.[4] Higher rates raise the opportunity cost of holding non-yielding gold, and US 10-year yields recently hit their highest level in two weeks above 4.50%.[5]
The Middle East conflict adds a complicating layer. Energy prices remain elevated following disruptions linked to the conflict, feeding into the inflation data that keeps the Fed on a tightening bias. Iran dismissed reports of talks in Doha on 30 June as unfounded,[6] so geopolitical uncertainty continues to provide some underlying support for safe-haven demand despite the broader bearish pressure from higher yields.
A firmer US dollar has also reduced demand for dollar-denominated bullion by making gold more expensive for overseas buyers. Fed Chair Kevin Warsh’s remarks, due this week, are the next event risk. J.P. Morgan Global Research noted that a Fed hiking cycle is the most significant bearish risk for gold, warning it could trigger sustained Western ETF outflows.[7]
Key XAUUSD Levels for Today
Reference levels from the 15-minute chart as of 09:00 (GMT+8), 1 July 2026:
| Level | Value | Context |
| MA50 (15-min) | $4,015.74 | Declining; acted as resistance on the 30 June recovery attempt |
| MA200 (15-min) | $3,993.28 | Nearer resistance; briefly reclaimed on 30 June then lost |
| Current price | ~$3,967 | Vantage XAUUSD CFD as of 09:00 (GMT+8), 1 July 2026 |
| 30 June high | ~$4,065 | Recent intraday high; the recovery attempt sellers capped |
| 28 June session low | ~$3,960 | Short-term floor on this chart; current price trades near here |
| RSI (14, close) | 38.87 | TradingView setup used for this analysis; overlay at 33.78 |
Table 1: Key reference levels as of 09:00 (GMT+8), 1 July 2026. Sources: TradingView, Vantage XAUUSD CFD. Indicative only.
What to Watch
Key events that could move gold prices this week:
- ADP Nonfarm Employment Change (June), 1 July 2026: A strong print reinforces the rate-hike narrative.
- Manufacturing PMI (June), 1 July 2026: A sharp contraction could complicate the Fed’s calculus.
- Nonfarm Payrolls and Unemployment Rate (June), 2 July 2026: The highest-impact release this week for gold prices.
- Fed Chair Warsh remarks, This week: Any hawkish signal is a direct input into XAUUSD pricing.
- US-Iran diplomacy, Ongoing: Iran dismissed Doha talk reports on 30 June. Any development shifts the energy and risk-premium picture.
Market participants often monitor Stop Loss placement around the key levels on this chart, particularly the 28 June 2026 session lows near $3,960 and the MA200 at $3,993.28. This is a data-heavy week: the ADP, NFP, and any Warsh commentary can each produce sharp intraday moves in gold CFD markets.
Those holding positions across correlated instruments, including the US dollar and Treasury yields, may find that all move in the same direction in a risk-off reaction to strong data. Reviewing overall exposure before each release is a standard part of risk management.
Leverage works in both directions. The NFP release on 2 July 2026 can produce sharp, fast moves, and the gap between a planned and actual exit can widen quickly in that window. Revisiting position sizing relative to account equity before each data release this week, not just once at the start of the session, is worth considering.
RISK WARNING: CFDs are complex financial instruments and carry a high risk of losing money rapidly due to leverage. You should ensure you fully understand the risks involved and carefully consider whether you can afford to take the high risk of losing your money before trading.
Disclaimer: The information is provided for educational purposes only and doesn’t take into account your personal objectives, financial circumstances, or needs. It does not constitute investment advice. We encourage you to seek independent advice if necessary. The information has not been prepared in accordance with legal requirements designed to promote the independence of investment research. No representation or warranty is given as to the accuracy or completeness of any information contained within. This material may contain historical or past performance figures and should not be relied on. Furthermore estimates, forward-looking statements, and forecasts cannot be guaranteed. The information on this site and the products and services offered are not intended for distribution to any person in any country or jurisdiction where such distribution or use would be contrary to local law or regulation.
References
[1] “Gold – Price – Chart – Historical Data – News – Trading Economics” https://tradingeconomics.com/commodity/gold Accessed on 1 July 2026.
[2] “Gold steadied near $4,000 amid JOLTS two-year high – Trading Economics” https://tradingeconomics.com/commodity/gold Accessed on 1 July 2026.
[3] “Gold Price Forecast: PCE Data, Fed Rate Bets – Capital.com” https://capital.com/en-int/market-updates/gold-price-forecast-30-06-2026 Accessed on 1 July 2026.
[4] “CME FedWatch Tool – CME Group” https://www.cmegroup.com/markets/interest-rates/cme-fedwatch-tool.html Accessed on 1 July 2026.
[5] “Gold Erases 2026 Gains as Fed Rate Bets Soar on Strong Jobs Shock – BullionVault” https://www.bullionvault.com/gold-news/gold-price-news/gold-fed-rates-jobs-060520261 Accessed on 1 July 2026.
[6] “Gold near 8-month low, Iran dismisses Doha talks – Trading Economics” https://tradingeconomics.com/commodity/gold Accessed on 1 July 2026.
[7] “Gold Price Predictions for 2026 and 2027 – J.P. Morgan Global Research” https://www.jpmorgan.com/insights/global-research/commodities/gold-prices Accessed on 1 July 2026.
