


US Dollar Index Chart: DXY Holds Near 100.70 After June Jobs Miss

Vantage Editorial Team >
Vantage Editorial Team >
Vantage is a global, multi-asset broker with a team of in-house writers and market analysts who produce educational and insightful trading content for traders of all levels.
 Updated Mon, 2026 July 6 02:49
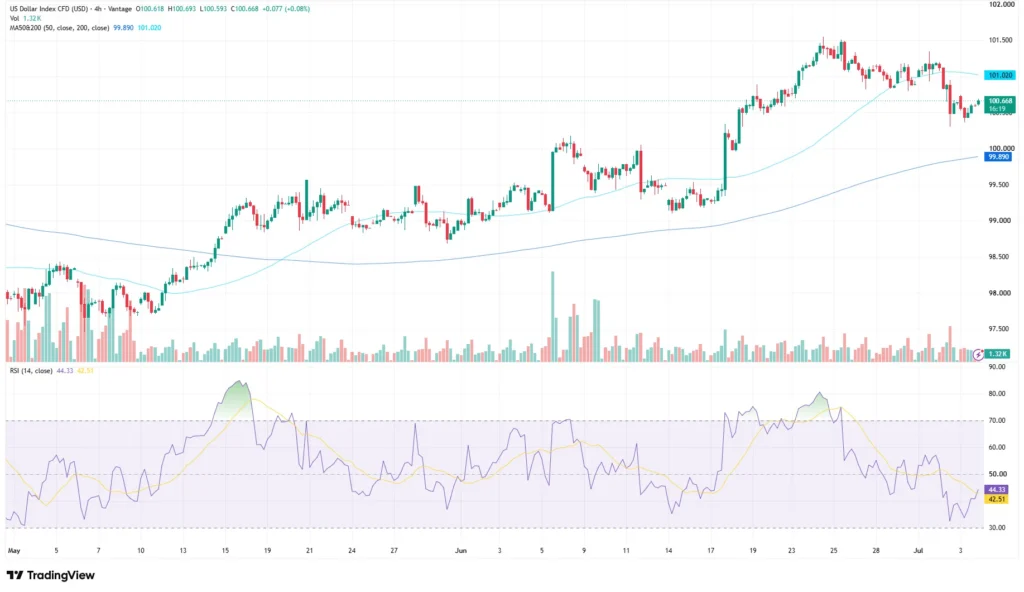
The US Dollar Index (DXY) traded near 100.67 as of the 3 July 2026 four-hour close (16:19 GMT+8 / 08:19 UTC), a little more than a point below the five-week high above 101.50 struck in late June. Two forces are pulling the dollar in opposite directions this week.
A Federal Reserve meeting on 17 June removed its earlier lean toward rate cuts and opened the door to a possible hike[1]. Then, on 2 July, a jobs report landed well short of forecasts, and traders pushed back how soon that hike might actually arrive[2].
This piece works through what the USDX chart is showing, what is driving the pullback, what it means across the wider dollar complex, and the levels traders are watching into the next Fed meeting. Whether you follow the US Dollar Index quote on a market-watch style ticker or the USDX chart below, the story this week is the same.
All prices are Vantage US Dollar Index CFD prices as of the cut-off above. Charts are indicative and from TradingView. This is not financial advice.
Key Points
- The US Dollar Index has pulled back to around 100.67 after reaching a five-week high above 101.50 in late June, with the 4-hour RSI cooling to 44.33 from an overbought reading near 80 in mid-June.
- Nonfarm payrolls rose by just 57,000 in June against a forecast near 110,000, and the unemployment rate fell to 4.2%, largely because fewer people were looking for work[3].
- The Fed’s June dot plot removed its rate-cut bias and flagged a possible hike, but the softer jobs data have since pushed the earliest likely hike timing further out[1,2].
What the US Dollar Index chart is showing
The DXY spent early May consolidating between 97.70 and 98.30 before a steady climb through the month took it to around 99.30 by mid-May. It ranged between 98.70 and 99.50 for most of early June, then broke higher in the days around the 17 June Federal Open Market Committee meeting[1], accelerating to a peak above 101.50 by around 24-25 June.
Since that peak, the index has given back roughly a point, trading near 100.67 as of the cut-off above. It remains above its rising 50-period moving average at 99.890, but below its 200-period moving average at 101.020, suggesting short-term support has held while longer-term resistance continues to cap the upside. Traders may watch the 99.89 50-period moving average as nearby support, while the 101.02 200-period moving average remains the first resistance before the recent swing high around 101.50.
The RSI, on the TradingView setup used for this analysis, has cooled to 44.33 after reaching overbought territory near 80 in mid-June. It dipped below its 42.51 signal line in early July before curling back above it, suggesting bearish momentum may be moderating rather than accelerating, though this does not yet point to a clear reversal. The most recent four-hour bar showed volume of 1.32K on the Vantage CFD feed.
The Fed’s hawkish tilt meets a softer jobs market

Kevin Warsh’s first meeting as Fed Chair produced a unanimous decision to hold the federal funds rate at 3.50%-3.75%, but the accompanying projections told a different story: the median policymaker penciled in higher rates by year-end, a reversal from the cut bias shown in March, and most officials judged inflation risks to be tilted to the upside[1]. Core inflation has stayed well above the Fed’s 2% goal, and Warsh has described persistently high prices as a burden the Committee is watching closely.
That hawkish signal is what carried the DXY toward its late-June high. Then, on 2 July, the picture got more complicated. Nonfarm payrolls rose by only 57,000 in June, against a forecast near 110,000, following a downwardly revised 129,000 in May[3]. The unemployment rate fell to 4.2%, but mainly because the labour-force participation rate dropped to its lowest since March 2021, not because more people found work[2].
Markets read the report as a reason to push the earliest possible hike further out, even as the Fed’s own projections still point toward one before year-end. That tension between a softer labour market and a central bank still flagging upside inflation risk is the central story behind the dollar’s choppy range this week[1,2].
Discover all latest Federal Reserve updates here.
What this means across the dollar complex
The yen has been the most exposed currency in this environment. USDJPY rose to around 162.80 per dollar on 30 June 2026, its weakest level for the yen in roughly four decades, even after the Bank of Japan raised its policy rate to 1% in June 2026, the highest since 1995[4]. Japan’s Ministry of Finance has said it stands ready to act “at any time as needed,” while deliberately declining to name an intervention threshold, a shift from its more telegraphed approach in prior operations[5]. The wide gap between US and Japanese policy rates continues to be the main pressure point on the pair.
The Euro has had a steadier week. The European Central Bank raised its three key rates by 25 basis points on 11 June 2026, a rare hike aimed at containing inflation pressure from the Middle East-linked energy shock, and EURUSD has stayed within its recent range since[6].
Sterling is in a similar holding pattern. The Bank of England voted 7-2 to keep Bank Rate at 3.75% on 18 June 2026, with two members preferring an immediate rise to 4%, and its next decision falls on 30 July 2026[7]. J.P. Morgan’s own published outlook has GBPUSD easing from around 1.34 toward the low 1.30s through the third quarter, with EURUSD guided toward a similarly contained range, consistent with a broadly firmer dollar backdrop[8].

Levels to watch and risk considerations
The table below covers the zones traders are monitoring across the dollar complex. These are reference levels traders are watching, not trade signals.
| Instrument | Support | Resistance | What’s happening |
| DXY | 99.89 (50-period MA) | 101.02 (200-period MA) / 101.50+ | Consolidating between its moving averages after the late-June 2026 rally faded |
| USDJPY | 160.00 (prior intervention zone) | 162.80 (40-year low) | Yen at multi-decade lows; intervention risk elevated |
| EURUSD | 1.1400 | 1.1900 | Range intact since the ECB’s June rate rise |
| GBPUSD | 1.3100 | 1.3400 | Holding inside J.P. Morgan’s published Q3 outlook range |
Table 1: Key levels across the dollar complex as of 3 July 2026. Sources: ECB, Bank of England, CNBC, J.P. Morgan, TradingView. Indicative only.
A few calendar items stand out for the days ahead:
- US CPI (June data), 14 July 2026: the next inflation print and the last major data point before the July FOMC meeting[9].
- US PCE (June data), 25 July 2026: the Fed’s preferred inflation gauge, released four days ahead of the meeting.
- FOMC decision, 28-29 July 2026: the first real test of whether the June hike signal holds once fresh inflation and jobs data are in hand[1].
- BoJ policy decision, 31 July 2026: any further tightening steps would widen or narrow the policy gap that has been weighing on the yen[4].
- Next Nonfarm Payrolls, 7 August 2026: the following read on whether June’s soft print was a one-off or the start of a trend. See all latest NFP news here.
The DXY has swung by more than three points in the space of six weeks, and this week’s reaction to a single data print is a reminder of how quickly that range can move. Traders often use nearby technical levels, such as the 50-period and 200-period moving averages, when deciding where to place Stop Loss orders, although the appropriate level depends on individual strategy and risk tolerance. Anyone holding correlated dollar exposure across yen, euro, and sterling pairs may also want to check the combined size of that exposure rather than treating each pair separately.
Leverage works both ways in a range like this: it can magnify a loss as easily as a gain, and a market pulled between a hawkish-leaning Fed and mixed data is not one where that risk cuts only one way. Position sizing relative to account equity is worth revisiting ahead of the 14 July 2026 CPI release and the 28-29 July 2026 FOMC meeting.

RISK WARNING: CFDs are complex financial instruments and carry a high risk of losing money rapidly due to leverage. You should ensure you fully understand the risks involved and carefully consider whether you can afford to take the high risk of losing your money before trading.
Disclaimer: The information is provided for educational purposes only and doesn’t take into account your personal objectives, financial circumstances, or needs. It does not constitute investment advice. We encourage you to seek independent advice if necessary. The information has not been prepared in accordance with legal requirements designed to promote the independence of investment research. No representation or warranty is given as to the accuracy or completeness of any information contained within. This material may contain historical or past performance figures and should not be relied on. Furthermore estimates, forward-looking statements, and forecasts cannot be guaranteed. The information on this site and the products and services offered are not intended for distribution to any person in any country or jurisdiction where such distribution or use would be contrary to local law or regulation.
References
[1] “Fed interest rate decision June 2026: Fed holds rates steady” – CNBC https://www.cnbc.com/2026/06/17/fed-interest-rate-decision-june-2026.html Accessed on 6 July 2026.
[2] “June jobs report shows just 57,000 payrolls, well below expectations” – CNBC https://www.cnbc.com/2026/07/02/jobs-report-june-2026-.html Accessed on 6 July 2026.
[3] “Employment Situation Summary – June 2026” – U.S. Bureau of Labor Statistics https://www.bls.gov/news.release/empsit.nr0.htm Accessed on 6 July 2026.
[4] “Japanese yen sinks to 40-year low, keeping intervention risks in focus” – CNBC https://www.cnbc.com/2026/06/30/japan-yen-falls-lowest-level-since-1986-dollar-intervention-risk.html Accessed on 6 July 2026.
[5] “Exclusive-Japan shifts to ambush intervention tactics against yen short sellers, sources say” – Reuters, via Investing.com https://www.investing.com/news/economy-news/exclusivejapan-shifts-to-ambush-intervention-tactics-against-yen-short-sellers-sources-say-4772275 Accessed on 6 July 2026.
[6] “Monetary policy decisions” – European Central Bank https://www.ecb.europa.eu/press/pr/date/2026/html/ecb.mp260611~4d41bd5e83.en.html Accessed on 6 July 2026.
[7] “Bank Rate maintained at 3.75% – June 2026 Monetary Policy Summary and Minutes” – Bank of England https://www.bankofengland.co.uk/monetary-policy-summary-and-minutes/2026/june-2026 Accessed on 6 July 2026.
[8] “Currency Volatility: Dollar Strength, Euro Weakness?” – J.P. Morgan https://www.jpmorgan.com/insights/global-research/currencies/currency-volatility-dollar-strength Accessed on 6 July 2026.
[9] “CPI Home” – U.S. Bureau of Labor Statistics https://www.bls.gov/cpi/ Accessed on 6 July 2026.
