


Brent Crude Oil Price Today: Surges to $84 as Iran Risk Returns

Vantage Editorial Team >
Vantage Editorial Team >
Vantage is a global, multi-asset broker with a team of in-house writers and market analysts who produce educational and insightful trading content for traders of all levels.
 Updated Tue, 2026 July 14 06:19
As of 09:52 (GMT+8) / 01:52 UTC on 14 July 2026, the Vantage UKOUSD CFD (Brent Crude Oil Cash) traded near $84.04, while the Vantage USOUSD CFD (WTI Crude Oil Cash) traded near $79.39, based on the TradingView setup used for this analysis.
The crude oil price story today has a familiar shape with a fresh twist. Reports of renewed military exchanges between the US and Iran, alongside fresh Iranian statements regarding transit through the Strait of Hormuz, have pushed the risk premium back into oil CFDs, just as official supply forecasts had started assuming the opposite. This piece reads the UKOUSD and USOUSD charts, covers this week’s crude oil news, and looks at the supply data underneath the price action.
Key Points
- UKOUSD (Brent) traded near $84.04 and USOUSD (WTI) traded near $79.39 as of the 14 July 2026 cut-off, both sitting well above their 50-period and 200-period moving averages after a sharp advance.
- Crude oil prices have climbed since 7 July 2026 following reports of tanker attacks near the Strait of Hormuz and renewed military exchanges between the US and Iran, which unwound part of the calm that followed a June ceasefire memorandum, with Brent futures reported near $78.82 a barrel on 13 July 2026.[1]
- The EIA’s July Short-Term Energy Outlook, built around that now-fraying ceasefire, had projected Brent averaging $74 a barrel in the third quarter. The renewed geopolitical tensions this week have increased uncertainty around that forecast.[6]
What the UKOUSD and USOUSD charts are showing
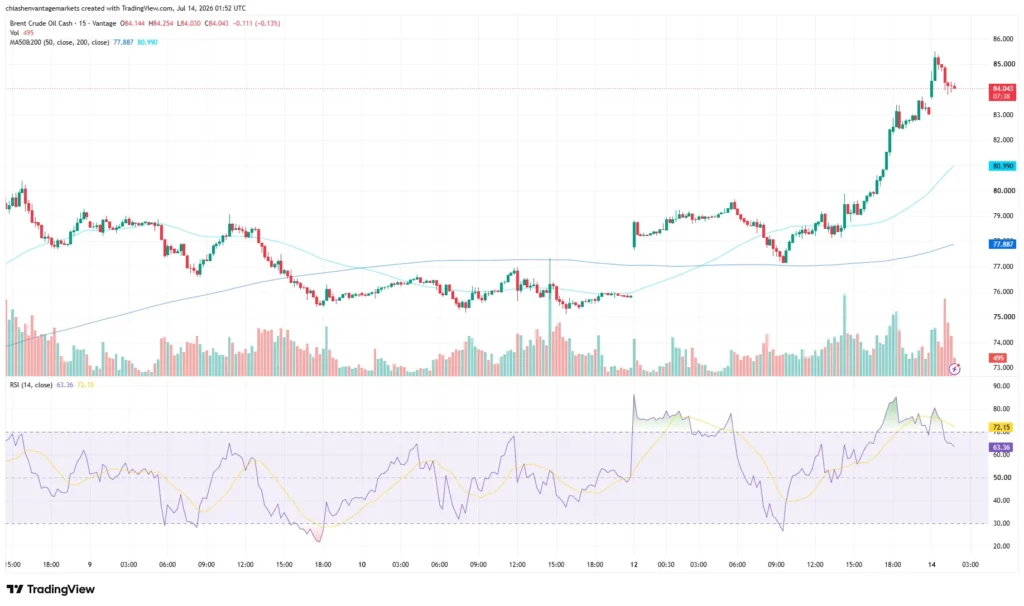
On the Vantage UKOUSD CFD, the 15-minute chart shows the session opening at $84.14, ranging between $84.25 and $84.03, and settling near $84.04, a move of -0.13%.[Fig. 1] The 50-period moving average sits near $77.89 and the 200-period average sits higher near $80.99. Price remains comfortably above both moving averages, consistent with the sharp upside breakout that began on 12 July 2026, lifting the pair out of a consolidation between roughly $75.50 and $76.50. The RSI (14) reads 63.36, with the moving-average overlay at 72.15, easing from recently overbought conditions reached earlier in the week.
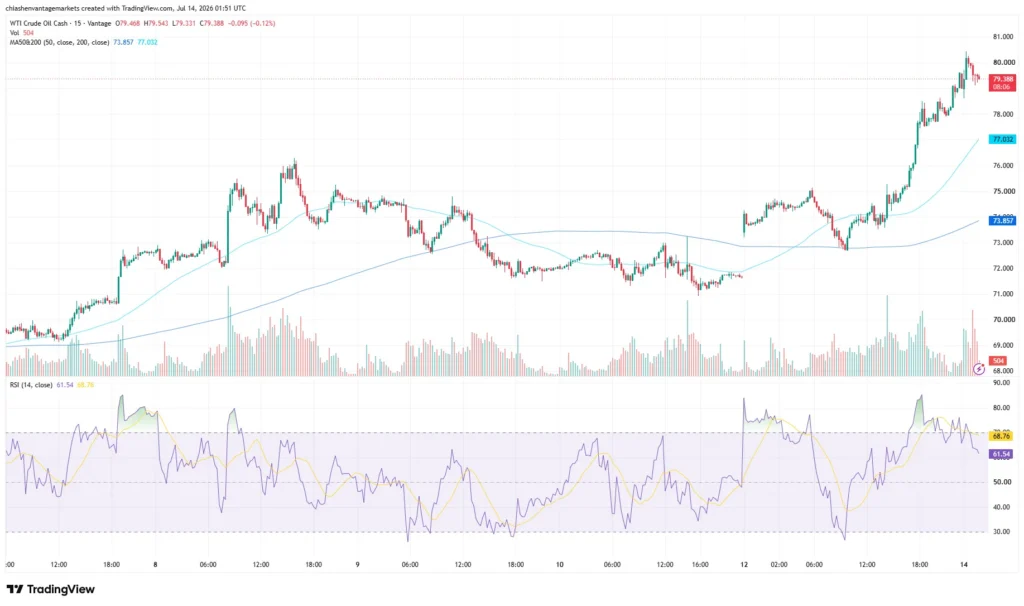
USOUSD (WTI crude oil price) shows a similar shape. The pair opened at $79.47, ranged between $79.33 and $79.54, and last traded near $79.39, a move of -0.12%.[Fig. 2] The 50-period moving average sits near $73.86 and the 200-period average near $77.03. WTI broke out of a $71.00 to $72.00 consolidation on 12 July 2026 and has extended higher since, though the latest candles show a pullback from the week’s high near $80.20. The RSI (14) reads 61.54 with the overlay at 68.76, also easing from recently overbought conditions reached mid-week. See the latest crude oil price news here.
The chart story matches across both oil CFDs: a sharp, news-driven breakout followed by a modest pullback, price still holding above both moving averages. Neither chart shows a confirmed reversal; the pullback sits inside the broader advance.
Why oil prices are climbing again
The renewed advance traces back to the fragile ceasefire between the US and Iran. A memorandum signed on 18 June 2026 had been intended to end months of conflict and support a shipping recovery through the Strait of Hormuz.[6] That calm did not hold. Tanker attacks near the Strait around 7 July 2026 coincided with the US revoking Iran’s authorisation to sell oil, and Brent settled 3% higher that session near $74.16 a barrel.[3] Days later, comments describing the ceasefire as effectively over coincided with WTI closing near $73.52 and Brent near $78.02.[2]
Matters escalated further into the week of 13 July 2026. Reports indicated Iran had stated that transit through the Strait of Hormuz would face further restrictions “until further notice,” a characterisation US Central Command did not confirm.[4] Reports also indicated the US carried out further strikes on Iranian targets, described as aimed at protecting shipping through the waterway, with Brent futures reported near $78.82 a barrel, the highest since 22 June 2026.[1] Reports also referenced a Kuwaiti offshore platform incident and a proposed transit fee increase, alongside OPEC’s monthly report trimming its 2026 oil demand growth forecast to 800,000 barrels per day, according to Trading Economics.[5]
The Strait carries around one-fifth of global seaborne oil trade, so shipping disruptions move both Brent oil and WTI quickly.[4] Leverage in CFD trading amplifies both the upside and downside of moves like this one, and traders should keep that double-edged nature in mind given how fast headlines have shifted crude oil prices this month.
The supply data behind the rally
The supply picture is more nuanced than the headlines suggest. The EIA’s Short-Term Energy Outlook, released 7 July 2026 before the latest escalation, assumed the 18 June 2026 memorandum held and shipping through the Strait kept normalising. On that basis, the EIA projected Brent averaging around $74 a barrel in the third quarter of 2026, a sharp downward revision from its prior outlook.[6] That forecast now looks out of step with a market that has since repriced the conflict risk higher.
Inventory data tells a similarly mixed story. US commercial crude oil inventories rose by 2.998 million barrels in the week ended 3 July 2026, the first increase after ten consecutive weekly declines.[7] Separately, the IEA’s July Oil Market Report noted that global observed oil inventories rose for the first time in four months during June, as previously stranded tankers reached their destinations and Gulf oil exports surged to around 16.1 million barrels a day, still below the roughly 24 million barrels a day seen before the conflict began.[8]
Put together, the data shows a market that had started rebuilding stock during the ceasefire window, only for that process to be interrupted again by the latest hostilities. Whether the current risk premium in crude oil prices proves lasting or temporary likely depends on whether shipping conditions through the Strait of Hormuz stabilise or deteriorate further.

Levels to watch and risk considerations
The table below sets out the reference levels traders are watching on both instruments, based on the moving averages and recent price action visible on the charts referenced in this piece.
| Instrument | 50-Period MA | 200-Period MA | Recent Range | What’s Happening |
| UKOUSD (Brent) | $77.89 | $80.99 | $75.50 to $86.00 (past week) | Holding above both averages after the 12 July breakout; pulling back from the week’s high |
| USOUSD (WTI) | $73.86 | $77.03 | $71.00 to $80.20 (past week) | Same pattern as Brent; consolidating just below the week’s high |
Table source note: Levels sourced from the Vantage UKOUSD and USOUSD CFD charts referenced in Figures 1 and 2, TradingView, as of 14 July 2026. Indicative only.
What to Watch
- EIA weekly petroleum inventory report, 15 July 2026: The next read on US crude, gasoline, and distillate stocks, and the first full week’s data since the latest escalation began.
- Strait of Hormuz shipping conditions: Any further change in tanker transit volumes or additional military activity would likely move both UKOUSD and USOUSD quickly in either direction.
- OPEC monthly report and demand commentary: Following this week’s downward revision to 2026 demand growth, further OPEC commentary could add or remove support for crude oil prices.
Stop Loss placement around the recent consolidation zones and the moving averages on both UKOUSD and USOUSD is something market participants are monitoring closely, given how quickly Middle East headlines have moved both instruments this month. A Stop Loss can help manage the size of a potential loss on a position, though it does not remove the risk of loss entirely, and gapping around geopolitical headlines can affect execution.
Leverage in CFD trading amplifies both potential gains and potential losses relative to the margin used, and this applies equally to UKOUSD and USOUSD given the volatility both instruments have shown this week. Position sizing relative to account equity is worth revisiting ahead of the next EIA inventory report, where intraday swings on Vantage Brent and WTI oil CFDs have exceeded typical range assumptions during this conflict. See last week’s Brent and WTI weekly analysis for further context.
RISK WARNING: CFDs are complex financial instruments and carry a high risk of losing money rapidly due to leverage. You should ensure you fully understand the risks involved and carefully consider whether you can afford to take the high risk of losing your money before trading.
Disclaimer: The information is provided for educational purposes only and doesn’t take into account your personal objectives, financial circumstances, or needs. It does not constitute investment advice. We encourage you to seek independent advice if necessary. The information has not been prepared in accordance with legal requirements designed to promote the independence of investment research. No representation or warranty is given as to the accuracy or completeness of any information contained within. This material may contain historical or past performance figures and should not be relied on. Furthermore estimates, forward-looking statements, and forecasts cannot be guaranteed. The information on this site and the products and services offered are not intended for distribution to any person in any country or jurisdiction where such distribution or use would be contrary to local law or regulation.

References
[1] “Oil prices jump as US and Iran trade attacks over Strait of Hormuz – Al Jazeera” https://www.aljazeera.com/economy/2026/7/13/oil-prices-jump-as-us-and-iran-trade-attacks-over-strait-of-hormuz Accessed on 14 July 2026.
[2] “Oil prices today: Brent, WTI rise as U.S. targets Iran – CNBC” https://www.cnbc.com/2026/07/08/oil-prices-brent-wti-iran-us-hormuz.html Accessed on 14 July 2026.
[3] “Oil prices rise after attacks on tankers in Strait of Hormuz, U.S. revokes Iran sale authorization – CNBC” https://www.cnbc.com/2026/07/07/oil-prices-iran-strait-hormuz.html Accessed on 14 July 2026.
[4] “Latest Oil Market News and Analysis for July 13 – Bloomberg” https://www.bloomberg.com/news/articles/2026-07-12/latest-oil-market-news-and-analysis-for-july-13 Accessed on 14 July 2026.
[5] “Crude Oil – Price – Chart – Historical Data – News – Trading Economics” https://tradingeconomics.com/commodity/crude-oil Accessed on 14 July 2026.
[6] “Short-Term Energy Outlook, July 2026 – U.S. Energy Information Administration” https://www.eia.gov/outlooks/steo/ Accessed on 14 July 2026.
[7] “Petroleum & Other Liquids Data – U.S. Energy Information Administration” https://www.eia.gov/petroleum/data.php Accessed on 14 July 2026.
[8] “Oil Market Report – July 2026 – International Energy Agency” https://www.iea.org/reports/oil-market-report-july-2026 Accessed on 14 July 2026.
