


[DAILY TRADING] SP500 Analysis 17 July 2026 – SP500 Today Holds Near 7,499 as Chip Selloff Meets Cooling Inflation
 Updated Updated Fri, 2026 July 17 09:00
![[DAILY TRADING] SP500 Analysis 17 July 2026 – SP500 Today Holds Near 7,499 as Chip Selloff Meets Cooling Inflation](/wp-content/themes/vantage/images/academy-post-default-img.webp)
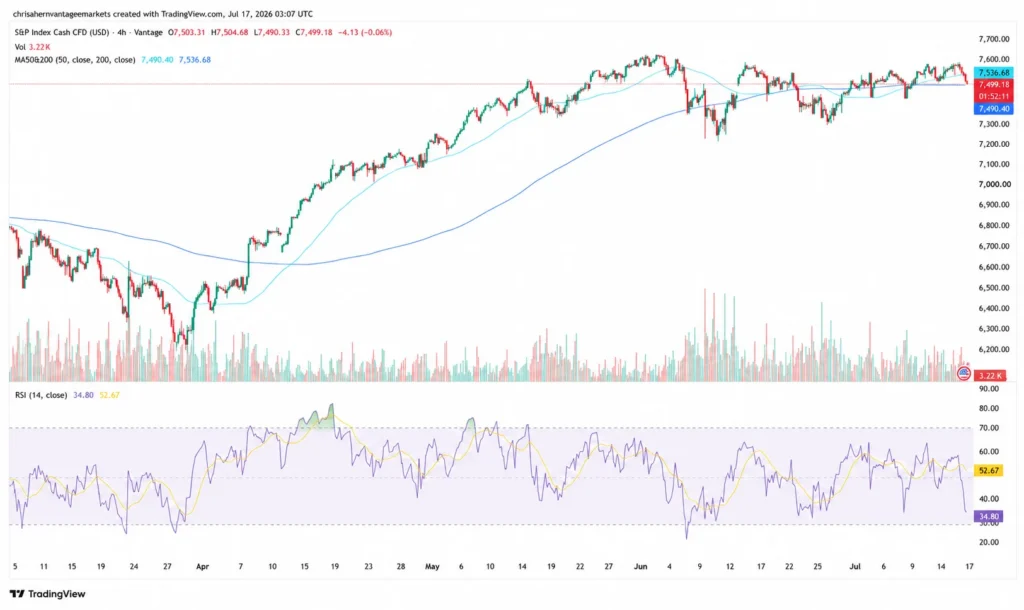
The SP500 index traded near 7,499.18 as of the 03:07 UTC (11:07 GMT+8) cut-off on 17 July 2026, per the Vantage SP500 CFD price feed. The SP500 price eased 4.13 points, or 0.06%, on the 4-hour chart, holding a tight range between 7,490.93 and 7,504.68.
Today’s SP500 news follows a heavier move lower on Thursday, when chip stock weakness pulled the Nasdaq Composite down 1.47% and the S&P 500 down 0.51% to close at 7,533.77[1,2]. Investors have spent the week weighing stretched valuations in semiconductor and AI infrastructure names against a milder-than-expected US inflation print.
Key Points
- The SP500 index traded near 7,499.18 as of 03:07 UTC (11:07 GMT+8) on 17 July 2026, sitting between its 50-period and 200-period moving averages on the 4-hour chart.
- Chip stock weakness dragged the broader market lower into Thursday’s close, even as June’s US inflation data showed prices falling for the first time since 2020.
- Fed Chair Kevin Warsh’s June hold left rates at 3.50% to 3.75%, with a hawkish dot plot; the next FOMC decision on the SP500’s rate backdrop is due 29 July 2026.
SP500 chart: what today’s session is showing
On the 4-hour chart, SP500 opened at 7,503.31, reached a high of 7,504.68, and dipped to a low of 7,490.93 before settling near 7,499.18[3]. That places the SP500 price just above its 50-period moving average at 7,490.40, and below its 200-period moving average at 7,536.68, on the TradingView setup used for this analysis [3].
The RSI (14) reads 34.80, below its moving-average overlay at 52.67, on the TradingView setup used for this analysis [3]. That is a softer momentum reading than the SP500 chart has shown for most of the past month, consistent with the pullback from the range highs traded in late June.
Zooming out, the SP500 index chart shows a sharp rally from the April lows near 6,700 to a peak above 7,600 by mid-June, followed by consolidation through late June and into July, with price yet to reclaim the 200-period moving average. Read all latest SP500 news here.
SP500 news: the macro drivers behind today’s session
Semiconductor weakness has been the standout story of the week. Chip names slid into Thursday’s close even after Taiwan Semiconductor Manufacturing posted a strong quarterly result, as higher capital expenditure guidance revived questions about whether AI infrastructure spending can keep generating matching returns [2]. Semiconductor exchange-traded funds fell sharply, pointing to a sector rotation rather than a single-stock story.
That rotation has coincided with a softer US inflation print. Data released 14 July showed the June consumer price index falling 0.4% month over month, the largest decline since April 2020, taking the annual rate down to 3.5% from 4.2% in May [3,4]. Core prices were flat in the month, supporting the view that underlying inflation pressures had moderated.
The Federal Reserve, under Chair Kevin Warsh, held its target range at 3.50% to 3.75% at the June meeting, its fourth consecutive hold, while dropping earlier language about additional rate adjustments [5]. The updated dot plot showed nine of 18 policymakers pencilling in at least one 2026 rate rise, a more hawkish tilt than earlier in the year. The next FOMC meeting runs from 28 to 29 July, with the decision being due on 29 July 2026 [6]. At the time of writing, markets were predominantly pricing a hold, with softer CPI data contributing to lower perceived near-term hike odds.
The Middle East conflict remains a background factor for risk sentiment and energy prices. Reporting this week noted US strikes expanding into northern Iran and a blockade on Iranian shipping restored after attacks on vessels in the Strait of Hormuz [7,8]. Shipping conditions through the strait remain a point market participants continue to monitor. Don’t miss out on all stock market news today here!
SP500 levels to watch
The table below covers the reference levels traders are watching on the SP500 chart. These are reference points from the session and chart setup, not trade signals.
| Reference | Level | What it shows |
| Session high | 7,504.68 | Intraday high on the 4H chart as of the cut-off |
| Session low | 7,490.93 | Intraday low on the 4H chart as of the cut-off |
| 50-period MA | 7,490.40 | Price is trading just above this average |
| 200-period MA | 7,536.68 | Price remains below this longer-term average |
Source: TradingView / Vantage SP500 CFD feed (https://www.tradingview.com/symbols/SPX500USD/). Levels reflect the 4-hour chart as of the stated cut-off time. Data as of 17 July 2026.

What to watch this week
- FOMC Meeting, 28 to 29 July 2026: Rate decision due 29 July 2026 at 2:00pm ET, a key input for SP500 index performance into month-end.
- Middle East conflict developments: Continued exchanges and mediation around the Strait of Hormuz remain a factor for energy prices and broader risk sentiment.
- Chip and AI-linked earnings: Further results and guidance from semiconductor and hyperscaler names could extend or ease this week’s valuation debate.
On risk management, the SP500 has traded in a band bounded by its 50-period and 200-period moving averages this week, a setup where ranges can compress and expand quickly around data and headlines. Market participants often monitor Stop Loss placement relative to these zones, and traders holding correlated positions across equity indices and chip-linked share CFDs may want to check their combined exposure given this week’s rotation.
Leverage works both ways in a range-bound, headline-sensitive market like this one. Position sizing relative to account equity is worth revisiting ahead of the 29 July FOMC decision, particularly for traders using leverage such as 1:1000 on index CFDs.
RISK WARNING: CFDs are complex financial instruments and carry a high risk of losing money rapidly due to leverage. You should ensure you fully understand the risks involved and carefully consider whether you can afford to take the high risk of losing your money before trading.
Disclaimer: The information is provided for educational purposes only and doesn’t take into account your personal objectives, financial circumstances, or needs. It does not constitute investment advice. We encourage you to seek independent advice if necessary. The information has not been prepared in accordance with legal requirements designed to promote the independence of investment research. No representation or warranty is given as to the accuracy or completeness of any information contained within. This material may contain historical or past performance figures and should not be relied on. Furthermore estimates, forward-looking statements, and forecasts cannot be guaranteed. The information on this site and the products and services offered are not intended for distribution to any person in any country or jurisdiction where such distribution or use would be contrary to local law or regulation.
References
[1] “Stock Market Today: Dow, S&P Live Updates for July 17 – Bloomberg” https://www.bloomberg.com/news/articles/2026-07-16/stock-market-today-dow-s-p-live-updates Accessed on 17 July 2026.
[2] “Dow drops 100 points; S&P 500 closes lower as Alphabet and chip shares sell off: Live updates – CNBC” https://www.cnbc.com/2026/07/15/stock-market-today-live-updates.html Accessed on 17 July 2026.
[3] “Consumer Price Index Summary – June 2026 – U.S. Bureau of Labor Statistics” https://www.bls.gov/news.release/cpi.nr0.htm Accessed on 17 July 2026.
[4] “US Inflation: CPI Falls for First Time Since 2020, Core Gauge Unchanged – Bloomberg” https://www.bloomberg.com/news/articles/2026-07-14/us-cpi-falls-for-the-first-time-since-2020-core-gauge-unchanged Accessed on 17 July 2026.
[5] “WATCH: New Fed Chair Kevin Warsh Holds First News Conference After Leaving Interest Rate Unchanged – PBS News” https://www.pbs.org/newshour/economy/watch-live-new-fed-chair-kevin-warsh-holds-first-news-conference-after-interest-rate-decision Accessed on 17 July 2026.
[6] “2026 July – Federal Reserve Meeting Calendar – Federal Reserve” https://www.federalreserve.gov/newsevents/2026-july.htm Accessed on 17 July 2026.
[7] “2026 Iran War – Britannica” https://www.britannica.com/event/2026-Iran-war Accessed on 17 July 2026.
[8] “July 10, 2026 – Mediators Work to De-escalate US-Iran Tensions and Revive Talks – CNN” https://www.cnn.com/2026/07/10/world/live-news/iran-war-trump Accessed on 17 July 2026.
