
 Updated
Elliott Wave Theory is a technical analysis method that forecasts market movements by identifying recurring wave patterns in price charts. Developed by Ralph Nelson Elliott in the 1930s, it holds that trends unfold in five waves in the direction of the trend, followed by a three-wave correction,
driven by shifts in crowd psychology.
The Elliott Wave theory is a method for mapping market crowd behaviour. It is a form of technical analysis that focuses on recurring price patterns in financial markets. These price patterns help traders assess risk and direction. At its core, Elliott says markets trend in waves.
In simple terms, waves move with the crowd, then push back. That push-and-pull creates a repeatable wave structure.
In this article, you will learn in minute detail what the Elliott Wave Theory is all about, its history, principles, and rules, how to trade it, common mistakes, and solutions
Where the theory came from
The theory was developed by Ralph Nelson Elliott. Many traders shortened his name to “Nelson Elliott”.
He studied charts, then published his theory for broader use in the late 1930s; it later gained wider attention after his book and market letters reached a larger audience of traders.
Over time, wave analysts developed clearer rules and guidelines to improve wave-count accuracy. These wave rules helped traders decide when a count is valid and when it must be rejected.
As markets evolved, Elliott Wave Theory spread beyond stocks into currencies, commodities, and indices. Groups such as Elliott Wave International helped standardise terminology and promote consistent methods for applying the Elliott Wave.
Over time, Elliott Wave Theory evolved into a comprehensive framework. Today, many traders still use it as an analysis tool for forecasting, planning trades, and improving trading decisions, often alongside other technical indicators.
The Principles of Elliott Wave Pattern: Impulse and Correction
Some technical analysts apply Elliott’s theory to study market behaviour or price patterns. The principles of Elliott wave split markets into two phases. They are impulse-propagating and corrective waves.
- An impulse moves with the main trend.
- A correction is a pause that runs counter to the trend.
This is why Elliott works well on trending markets. You first define the trend’s direction. Then you ask whether the price follows the main trend.
Elliott wave patterns you must know
Most charts can be simplified into two repeating forms. These two Elliott wave patterns appear across markets and timeframes.
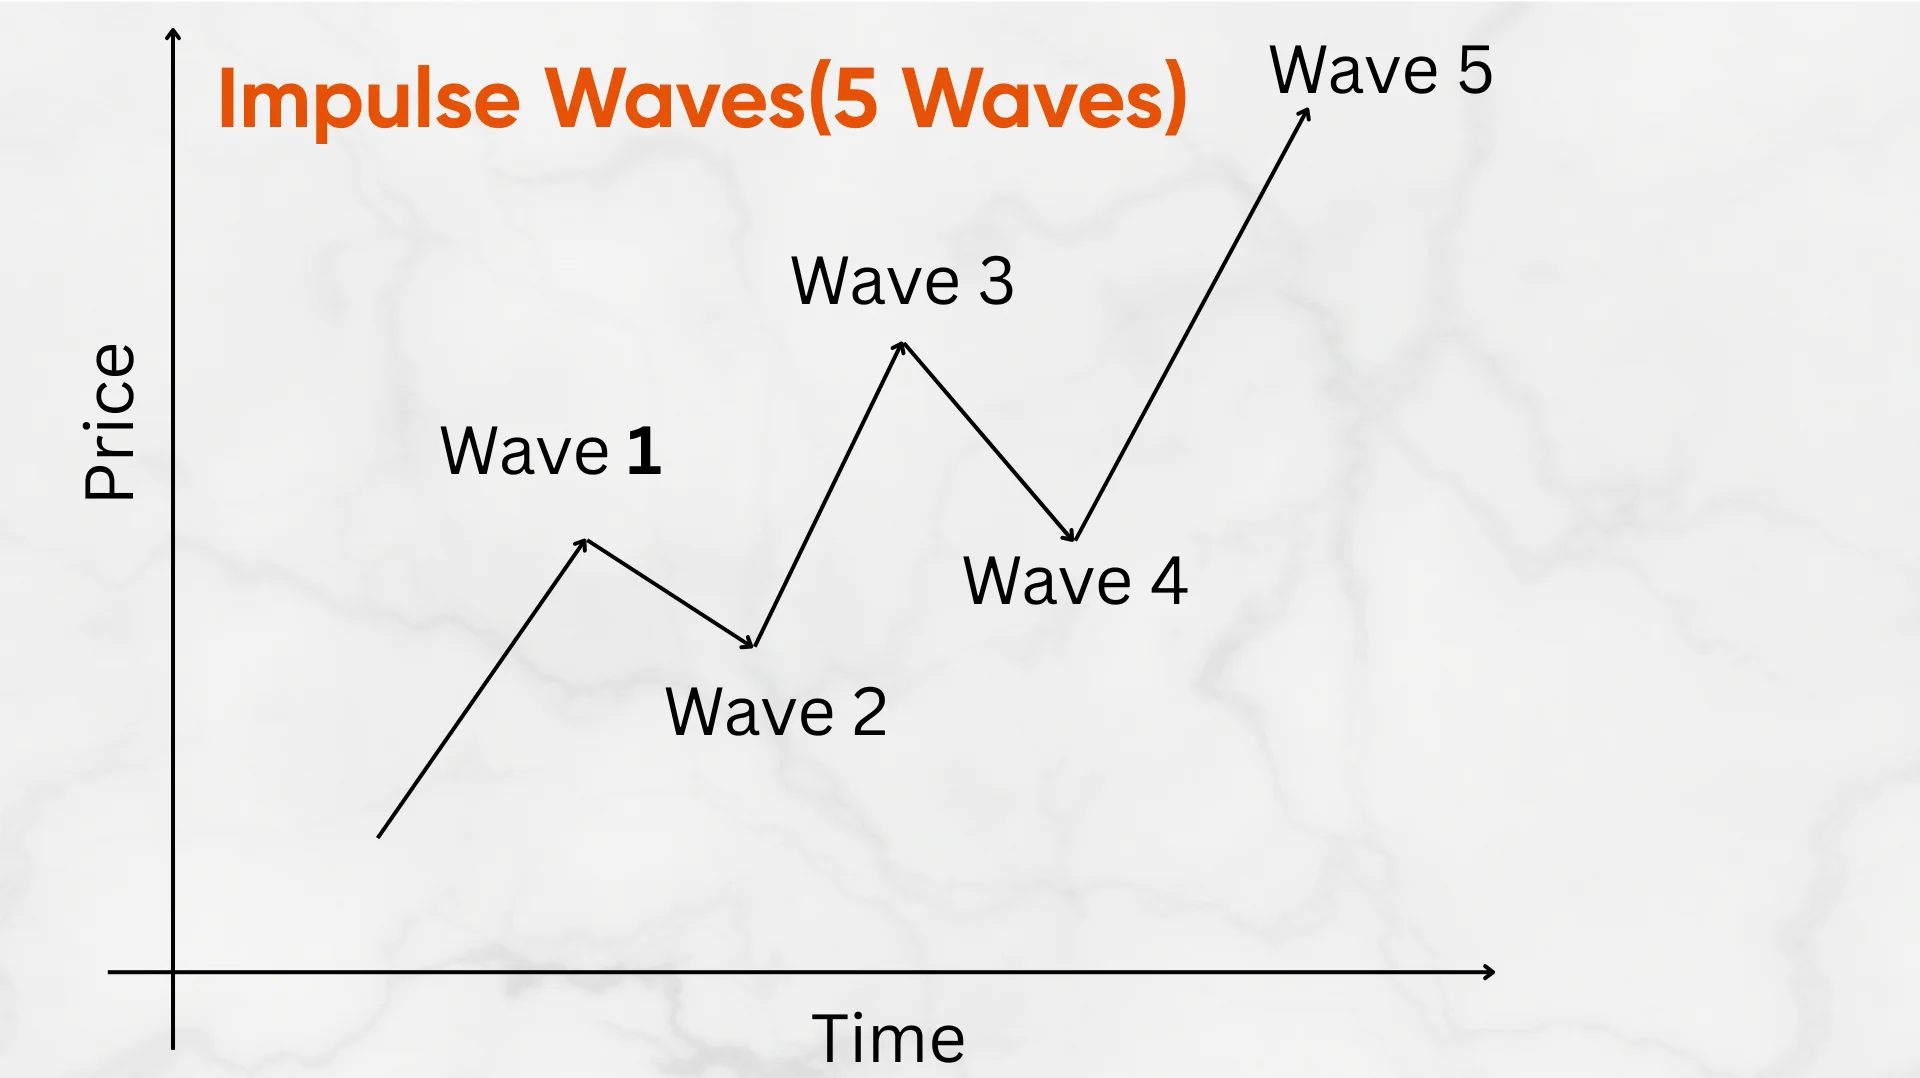
1) The impulse: 5 waves
It refers to the upward movements in uptrends or the downward movements in downtrends. One beautiful thing about these waves is that they persist for a long time, be it hours, years, or decades.
An impulse is a five-part move in the direction of the trend. Each part has a role in the story.
- The first wave(Wave 1) starts the new move.
- Wave 2 is a pullback that tests conviction.
- While Wave 3 produces the strongest push, often with volume.
- In Wave 4, a pause occurs, often sideways and complex.
- Wave 5: the final push before a larger correction.
2) The correction: 3 waves
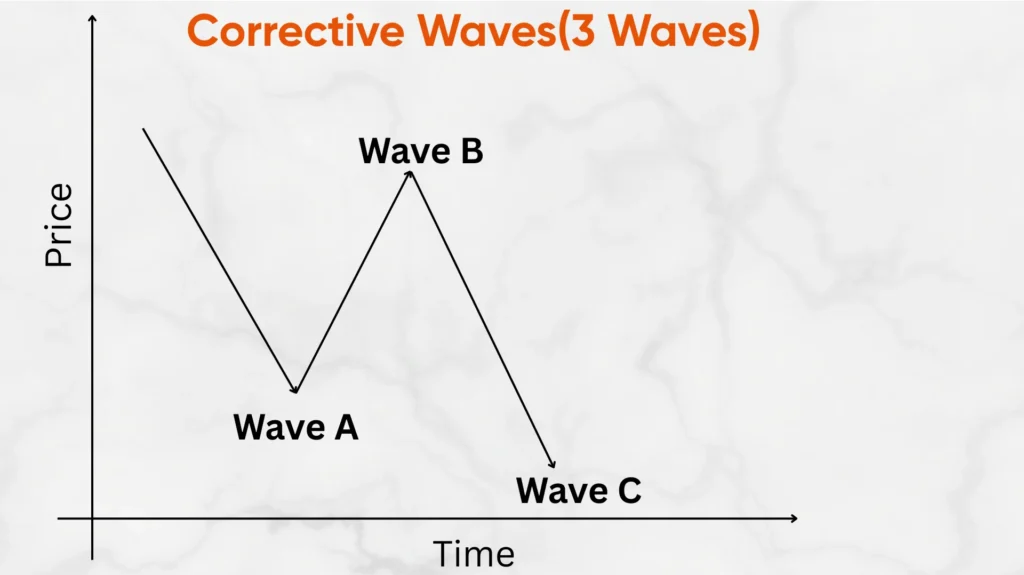
It is often referred to as diagonal waves. It consists of three waves that often follow a simple A-B-C structure. That A-B-C is the classic three-wave pattern.
This is the common corrective pattern after a strong trend push. In Elliott’s terms, corrective waves subdivide into smaller waves as well. This is why labelling requires patience and clean swing points.
The defined rules: what can’t be broken
Elliott is not “draw-anything” chart art. It has defined rules that keep the count honest. These are the most used Elliott wave rules.
Rule 1: Wave 2 cannot erase Wave 1
Wave 2 can retrace Wave 1, but not 100%. If Wave 2 breaks the start, your wave count is wrong.
This matters because many traders chase early entries. They think Wave 1 is the breakout, but it gets stopped. A clean Wave 2 pullback sets a better risk.
Rule 2: Wave 3 is never the shortest among 1, 3, and 5
Wave 3 is the most powerful and usually the largest and clearest move. This is why traders focus on the relationships between waves 1 and 3.
You often see this sequence in real time. First, wave one gains traction and attracts early adopters. Then wave three starts as the crowd finally believes. It’s often driven by news, economic reports, and market sentiments.
Rule 3: Wave 4 cannot overlap Wave 1 in a standard impulse
This is another corrective wave. This wave is a pause, not a reset into old territory. And it’s less intense than wave 2. Many counts fail here, especially in choppy markets.
A simple reminder helps most traders. 2 and 4 are smaller moves versus the trend waves. Also, 4 are smaller retraces when Wave 3 is extended.

Elliot Wave Practical Guidelines
- Elliott Wave works best when you keep it simple. Many traders fail because they over-label every swing. Your job is not to predict every tick. Your job is to find a clean wave structure and manage risk.
- Start with the larger trend. Look at the higher timeframe first. If the trend is up, your main focus is the five-wave impulse. If the trend is down, you look for the bearish version. A good wave count should feel “obvious,” not forced.
- Use the rules before the guidelines. If a count breaks a core rule, drop it fast. Don’t argue with the chart. Elliott Wave is an analysis tool, not a belief system.
- Respect wave degree. A five-wave move on the 15-minute chart can be contained within a correction on the 4-hour chart. This is why traders get trapped. They think Wave 5 is the top, but it is only a lower-degree wave.
- In a five-wave pattern, expect Wave 2 and Wave 4 to alternate. This is the alternation idea. If Wave 2 is sharp and deep, Wave 4 is often sideways and slow. If Wave 2 is mild, Wave 4 can surprise you with a stronger pullback. This guideline alone improves trading decisions.
- Don’t chase Wave 5. Wave 3 is usually the cleanest opportunity. By Wave 5, momentum often fades and risk rises. If you trade Wave 5, use a smaller size and tighten the invalidation levels.
- Use technical indicators as support, not as proof. Momentum tools can help confirm Wave 3 strength or warn of Wave 5 exhaustion. But price patterns come first.
Wave degree and lower-degree waves
Elliott only works if you respect the timeframe context. That context is called wave degree.
A daily chart can contain a full five-wave impulse. Inside it, you will find lower-degree waves on the four-hour chart. Those lower waves must also follow the same core logic. This is where traders get trapped. They label small noise as Wave 5 too soon. Then a larger correction wipes the idea.
When the pattern flips
Trends can reverse, and Elliott offers a clear way to frame them. After a top, the bearish structure often mirrors the bullish one.
You may hear: pattern is reversed, five waves. Or traders say: reversed, five waves down and three. That means a five-wave decline, then an A-B-C bounce.
Corrections, counter-trend impulses, and tricky moves
Not all counter moves are simple A-B-C waves. Sometimes you get a sharp five-part drop against a larger uptrend.
That is a five-wave counter-trend impulse on a smaller degree. It often shows up as risk-off bursts or liquidation waves. It can still be tradable, but the risk must be tight.
Diagonals and Overlap Exceptions (Where Rule 3 Changes)
In a standard impulse wave, Rule 3 is strict: Wave 4 cannot overlap Wave 1 price territory. That rule keeps the wave structure clean and trending. But markets do not always move in a textbook way. This is where diagonal patterns matter, because diagonals are the main exception to the overlap rule.
What a diagonal is
A diagonal is a wedge-shaped impulse pattern. Price still moves forward, but with overlap and weaker follow-through. The swings often look like a tightening range, with converging trendlines.
In diagonals, Wave 4 can overlap Wave 1. That is the key change to Rule 3
Two main types of diagonals
1) Leading diagonal
This can show up in Wave 1 of a new trend, or in Wave A of a correction. It often appears when a new move begins, but conviction remains low. Price pushes forward, then pulls back deeply, creating overlap.
2) Ending diagonal
This often appears in Wave 5 of an impulse or in Wave C of a correction. It tends to appear near the end of a move when momentum fades. You may see clear slowing, choppy advances, and frequent pullbacks.
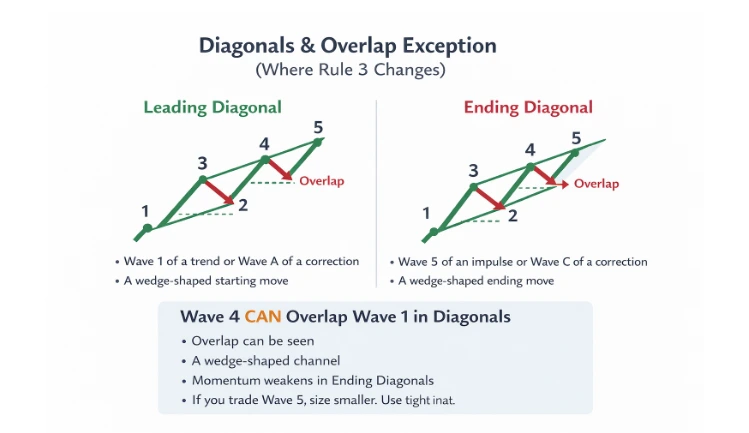
Chart 3: Diagonals and Overlap Exception. Chart is for educational purposes only.
How diagonals are built
Diagonals still have a five-wave labelling (1–2–3–4–5), but their internals are different from a normal impulse. The legs often look like smaller three-wave moves rather than clean five-wave pushes. That is why diagonals feel “messy” compared to a strong trend wave.
How to spot a diagonal in real time
- Overlap between Wave 4 and Wave 1
- A wedge or narrowing channel
- Slower progress with deeper pullbacks
- Momentum divergence, especially in ending diagonals
Why it matters for trading
Diagonals often signal transition. A leading diagonal can signal a new trend, but it may remain volatile. An ending diagonal often signals that the move is running out of steam and that a reversal or sharp correction is near. Traders can study invalidation levels and leverage for educational purposes without applying them to live trading.
How Elliott Wave theory may be applied in analysis
Many traders ask how to apply Elliott wave theory to trading. Start simple and focus on repeatable setups.
Example 1
Analysts often observe the Wave 2 pullback and Wave 1 high to study Elliott Wave patterns. This illustrates how wave rules may be applied for analysis, not as a recommendation to trade.
Example 2
Wave 3 often demonstrates a strong trend segment. Observing its characteristics can help illustrate trend behavior within the Elliott Wave framework.
Example 3
Wave 5 may show momentum changes. Studying this can highlight how trend exhaustion appears, for educational purposes only.
Common Mistakes (And How to Avoid Them)
Most Elliott Wave mistakes come from forcing the chart to match a story. The best way to improve is to keep your process strict and your labels simple.
- Forcing a wave count to fit bias.
If you “need” the market to be in wave 3, you will find it.
Avoid this by writing invalidation levels first. If a rule breaks, the count is wrong. - Counting every small wiggle.
Over-labeling turns noise into fake structure. Avoid this by starting on a higher timeframe. Mark only clear swing highs and lows. - Ignoring wave degree.
A five-wave move on a small chart can be part of a larger correction.
Avoid this by checking one or two timeframes above your trading chart. - Breaking core rules and keeping the count.
Many traders treat rules like guidelines. That destroys accuracy.
Avoid this by memorizing the three impulse rules and applying them first. - Misreading corrections.
Corrections can be messy, overlapping, and slow. Avoid this by waiting for the correction to “finish” before labeling it. Use A-B-C only when the structure is clear. - Chasing wave 5.
Wave 5 can be tempting, but it often has weaker momentum.
Avoid this by focusing on wave 3 setups. Observing Wave 5 can illustrate how momentum often fades at the end of a trend, highlighting risk considerations in analysis. - Using indicators to override price.
Indicators can lag and can mislead in strong trends. Avoid this by letting price patterns and wave rules lead. Use indicators only as support. - Not keeping an alternate count. Markets shift, and your main count can fail fast. Avoid this by keeping one alternate scenario with its own invalidation.
If you keep rules strict, zoom out first, and stop forcing labels, Elliott Wave becomes far more useful.
The Elliott Wave Theory and Modern Trading
Some desks now test wave logic with code. This includes algorithmic trading models and pattern scanners.
Still, machines struggle with subjective labelling. That is why humans keep an edge with context. It remains an analysis that helps more than a signal machine.
Tools and Indicators That Pair Well With Elliott Wave
Elliott Wave is an analysis tool, but it works best with a few simple add-ons. The goal is not to “prove” a wave count. The goal is to confirm trend strength, spot weak spots, and set clean risk levels.
Trend Indicators
A basic moving average helps you stay on the right side of the larger trend. If price holds above a rising average, the impulse case is stronger. If the price keeps falling below a declining average, the bearish count has more weight.
Trendlines and channels are also useful. In a clean impulsive wave, the price often respects a channel. When price breaks the channel late in a move, it can hint that wave 5 is ending.
Momentum indicators help with wave 3 and wave 5
Relative Strength Index(RSI) and Moving Average Convergence Divergence (MACD) are common choices. In wave 3, momentum often expands and stays firm during smaller retraces. In wave 5, you may see divergence: price makes a new high, but RSI or MACD does not. That mismatch can signal fading strength and a higher chance of a corrective pattern.
Volume analysis
In many markets, wave 3 attracts the most participation. Rising volume during wave 3 supports the wave structure. Weak volume during wave 5 can warn that the move is running out of fuel.
Fibonacci tools pair naturally with Elliott
A fundamental tool for Elliot Wave Practitioners. Traders use retracements to estimate the pullbacks of waves 2 and 4. They use extensions to project wave 3 and wave 5 targets. Fibonacci is not magic, but it can help you plan entries, targets, and invalidation points with less guesswork.
Market structure
Support and resistance zones, prior swing highs/lows, and break-of-structure points keep your wave count grounded in price patterns. If a count ignores key levels, it is usually wrong.
Used together, these tools don’t replace Elliott Wave. They make it clearer, cleaner, and easier to trade with disciplined risk.
Frequently Asked Questions
What are the most commonly used platforms in South Africa for Elliott Wave analysis?
Platforms such as MetaTrader 4 (MT4) and MetaTrader 5 (MT5) provide tools and indicators for Elliott Wave analysis. Many platforms also allow scripts and indicators on web and mobile interfaces. This information is for educational purposes only.
How do top investment apps incorporate Elliott Wave indicators?
Most apps do it through chart tools and add-ons, such as built-in wave drawing or plug-in indicators that automatically label waves using swing points (often using ZigZag-style logic). Some also add auto-Fibonacci zones, alerts, and pattern invalidation levels to help you spot wave breaks faster.
What is Elliott Wave Theory?
Elliott Wave Theory is a technical analysis method that holds that market prices move in repeating “waves” driven by crowd sentiment. It’s usually tracked as a 5-wave move in the main trend, followed by a 3-wave correction, and it repeats across timeframes.
RISK WARNING: CFDs are complex financial instruments and carry a high risk of rapid loss of money due to leverage. You should ensure you fully understand the risks involved and carefully consider whether you can afford to take the high risk of losing your money before trading.
Disclaimer: The information is provided for educational purposes only and doesn’t take into account your personal objectives, financial circumstances, or needs. It does not constitute investment advice. We encourage you to seek independent advice if necessary. The information has not been prepared in accordance with legal requirements designed to promote the independence of investment research.
No representation or warranty is given as to the accuracy or completeness of any information contained within. This material may contain historical or past-performance figures and should not be relied upon. Furthermore, estimates, forward-looking statements, and forecasts cannot be guaranteed. The information on this site and the products and services offered are not intended for distribution to any person in any country or jurisdiction where such distribution or use would be contrary to local law or regulation.
References
- https://www.investopedia.com/terms/m/marketsentiment.aspWhat is market sentiment?
- https://www.investopedia.com/terms/i/impulsewave.asp Impulse wave pattern: Definition, rules, and Trading Strategies
- https://en.wikipedia.org/wiki/Elliott_wave_principle Elliot Wave Principle
- https://www.investopedia.com/terms/e/elliottwavetheory.asp Elliot Wave Theory: What it is and how to use it
- https://elliottwave-forecast.com/elliott-wave-theory Elliot Wave Theory