

Market capitalisation or market cap is the total value the stock market places on a company at today’s price. It is often used to rank companies and compare their relative sizes in a particular sector.
Mathematically, Market Cap = Current Share Price × Total Shares Outstanding.
This article discusses market capitalisation in relation to underlying share markets. The broker provides Contracts for Difference (CFDs), which are derivative instruments and do not represent ownership of the underlying shares.
A higher market cap generally reflects a larger, more established company. Lower market capitalisation companies may exhibit higher variability and risk, and this does not indicate future performance. Market cap can also change fast, because share prices move daily. Companies may also issue new shares or buy shares back, which changes shares outstanding.
What is the Market Capitalisation of the JSE
JSE market capitalisation most often refers to the combined value of all companies listed on the Johannesburg Stock Exchange. When referring to the JSE market capitalisation, it generally means the combined value of all listed shares on the exchange.
For instance, if a company A has issued 10,000 shares with each valued at 50 Rands (R50), then the market capitalisation of the company is R500,000. On the other hand, if another company had issued 20,000 shares, each valued at 70 Rands(R70). The market cap for company B will be R1,400,000(R1.4m).
Suppose that the JSE has 7 publicly quoted companies listed with their market cap as indicated in the table below: The JSE Market Cap is R5,812,000.
| Quoted Companies | Number of Shares | Share Price | Market Cap |
| Company A | 10,000 | 50 Rands | R500,000 |
| Company B | 20,000 | 70 Rands | R1,400,000 |
| Company C | 5,000 | 150 Rands | R750,000 |
| Company D | 3500 | 500 Rands | R1,750,000 |
| Company E | 1750 | 350 Rands | R612,500 |
| Company F | 4000 | 200 Rands | R800,000 |
| JSE Market Cap | R5,812,000 |
What Moves Market Capitalisation
Several factors contribute to the movement of market capitalisation. These factors include:
1) Price
A company’s share price is the fastest and biggest driver of how big the market capitalisation is. It is driven by market sentiments and investor confidence.
If a company’s share price rises 10% and nothing else changes, its market cap rises 10%. That’s because the formula is price-driven day to day.
Prices move for many reasons. They include;
- New earnings results and guidance: Better profits or stronger forecasts often lift prices.
- Interest rates and inflation: Higher rates can pressure valuations, most especially growth stocks.
- Risk sentiment in the wider market: In risk-on and risk-off markets, equities can rise or fall.
- Sector news and announcements: Regulatory changes, financial performance, and more. All of these can affect stock prices.
- FX effects: For firms earning in USD or EUR, a weaker ZAR can boost reported earnings and sometimes the share price.
Because price moves daily, so is market cap.
2) Share count changes
Even if the stock price stays the same, a company’s market cap will move if it issues new shares or buys back existing ones
Common drivers include:
- New shares issued. Rights issues, placements, or IPO shares increase shares outstanding. If price holds up, market cap rises. If the price of shares drops due to dilution fears, the net effect of that drop may be small in terms of its effect.
- Share buybacks. Repurchases reduce shares outstanding (or move shares into treasury). That can support per-share metrics, and it changes market cap math.
- Employee options and conversions. Option exercise can add shares over time, lifting the share count.
- Stock splits and reverse splits. These change the share count and the price per share, but they do not change the company’s value by themselves. The price adjusts to match the new share count.
3) Listings add market cap to the exchange total
At the exchange level, the total market cap rises when new firms list. This can happen through
- IPO: Initial Public Offering is the first time a private firm sells shares to the public on a stock exchange. That newly listed value gets added to the exchange total.
- Dual or Secondary Listings: When a company is already listed elsewhere lists on the JSE too. Depending on how the listing is structured and measured, this can increase the reported market cap on the exchange.
4) Delistings remove market cap from the exchange total
Total market cap falls when firms leave the exchange. A stock can delist voluntarily (going private, merging) or be forced off for failing listing rules. Once it’s removed from the exchange, its market cap no longer counts in that exchange’s total. This can happen through:
- Acquisitions and takeovers: The target firm is bought and removed from the market.
- Mergers: Two firms combine, and one ticker disappears.
- Voluntary delisting: A company chooses to go private or move to another venue.
- Financial distress: Suspensions and eventual delisting can remove a company from the total.
You can explore using the Vantage Demo Account. Or grab your Free Vantage Live account to test with real market conditions on the Vantage Markets trading platform.
Market Cap Vs Share Price
In simple definitions.
Share price is the current market price of one share of a company.
Market cap is the total market value of a company’s equity: Current Share Price × Total Shares Outstanding.
Here are the differences between the share price and the market cap.
| Feature | Share price | Market Cap |
| What it is | Price of one share | Total value of all shares |
| Unit | Currency per share (e.g., R25/share) | Currency total (e.g., R50 billion) |
| Mai driver | Trading demand and supply | Share price and share count |
| Changes when | Price moves in the market | Price moves, or shares outstanding change |
| Commonly used for | Entry/exit levels, charting | Comparing company size across firms |
| Can mislead when | Comparing firms with different share counts | Comparing firms with very different debt levels (use EV for that) |
Market Cap Tiers
The different market cap tiers differ by group companies by size, using market value.
There is no single global cut-off. Some providers use fixed values, others use market percentiles.
Large-Cap
Large-cap companies are generally more established and widely followed. Market characteristics such as liquidity and participation can vary across companies and market conditions. Large-caps are typically $10B to $200B in market value. They are often well-known firms with a steady cash flow. Price movements vary across all market cap groups and can change depending on market conditions.
Characteristics
- Volatility levels vary across companies and market conditions.
- More analyst coverage and frequent news flow.
- Strong index influence, since they carry large weights.
- Dividend policies vary by company and are not guaranteed.
Example: Apple market cap (large-cap companies) around $4.033T (Feb 2026), a clear large-cap.
Mid-Cap
Mid-cap companies typically fall within a mid-range market capitalisation bracket. Their characteristics may differ depending on business conditions and market environment.
Characteristics
- Moderate volatility, with faster repricing on earnings surprises.
- Market liquidity can vary depending on company size and trading conditions.
- Business models may still be expanding into new regions.
- Companies may move between market capitalisation categories as market values change.
Example: Dropbox’s market cap (mid-cap company) is about $6.53B (Feb 2026), which fits mid-cap.
Small-Cap
Small-cap companies generally have lower market capitalisation and may experience higher volatility and business risk. This does not imply future performance. Market liquidity may vary, and price movements can become more pronounced during significant news or market events.
Characteristics
- Higher volatility and larger gaps around results or headlines.
- Thinner liquidity, which can widen spreads in fast markets.
- Less analyst coverage, so “surprises” can hit harder.
- More sensitivity to funding costs and credit conditions.
Example: Fiverr market cap around $0.57B (Feb 2026), which sits in the small-cap.
How to check the Market Capitalisation of JSE-listed companies
In checking the market cap of JSE-listed companies. You can try any of these methods
Method 1: Check on ShareDataOnline
- Find the company’s JSE share code.
- Go to ShareDataOnline and search for the code or name.
- Open the company quote or summary page.
- Look for Market Cap/Market Capitalisation.
- Note the date, since prices change every day.
For example, the ABSA group has the code ABG. When you scroll down, you will see the market capitalization.
Method 2: Use the JSE market data files
- Go to the JSE Market Data or Market Statistics page.
- Download the latest equity ranking or market stats file.
- Open it in Excel.
- Search the share code with Ctrl + F.
- Read the market cap value in the table.
Method 3: Use the company’s Investor Relations page
- Search the company name plus “Investor Relations”.
- Open the “share information” page.
- Check the market cap figure, if shown.
Where to Find Total JSE Market Cap Data
Total JSE market cap means the combined market value of listed shares. Here are sources to find JSE market cap data:
- JSE Market Statistics: This is the best public source for the total market size.
- World Federation of Exchanges (WFE) market statistics: Good for a clean monthly time series and global comparisons.
- World Bank market cap series: Good for long-run charts and quick downloads.
- JSE Historical Market Data: Best if you need bulk history or custom date ranges.
Top 10 Global Companies by Market Cap (Feb 2026)
How we built this list
Market caps are from CompaniesMarketCap’s “Largest Companies by Marketcap” list. Revenue (TTM), net income (TTM), and 1-year trailing total return are from FinanceCharts. Exchange and founding year are from the StockAnalysis company profiles. All figures can change daily.
| Rank | Company | Ticker | Market Cap (USD) | Exchange |
| 1 | NVIDIA | NVDA | $4.450 T | NASDAQ |
| 2 | Apple | AAPL | $3.759 T | NASDAQ |
| 3 | Alphabet (Google) | GOOG | $3.701 T | NASDAQ |
| 4 | Microsoft | MSFT | $2.982 T | NASDAQ |
| 5 | Amazon | AMZN | $2.133 T | NASDAQ |
| 6 | TSMC | TSM | $1.900 T | NYSE |
| 7 | Saudi Aramco | 2222.SR | $1.651 T | Tadawul (Saudi Exchange) |
| 8 | Meta Platforms | META | $1.618 T | NASDAQ |
| 9 | Tesla | TSLA | $1.566 T | NASDAQ |
| 10 | Broadcom | AVGO | $1.541 T | NASDAQ |
#1 NVIDIA (NVDA)

Business summary
NVIDIA sells GPUs that power AI training and data center work. Its main profit driver is data center chips for cloud and enterprise servers. Gaming still matters, but AI demand now sets the pace. Watch new chip launches and long supply deals with top cloud firms.
Rising AI data center spending supports revenue growth and strong margins. Key risks are export limits, big customer swings, and fast-moving rivals.
Key facts and metrics
- Company Name: NVIDIA
- Market Cap: $4.450 T
- Revenue (TTM): $187.142B
- Net Income (TTM): $99.198B
- 1-year Trailing Total Return: 35.16%
- Exchange: NASDAQ
- Year Founded: 1993
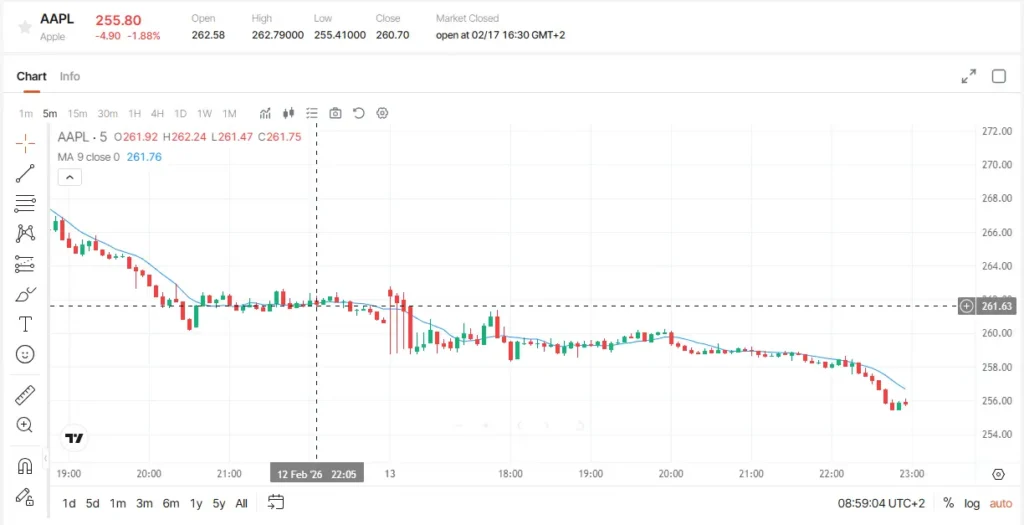
#2 Apple (AAPL)
Business summary
Apple earns most sales from the iPhone, while services keep cash flow steady. Its ecosystem keeps users through iOS, apps, and paid add-ons. Hardware cycles lift results when new models trigger upgrades. Services like App Store fees, iCloud, and payments support higher margins.
Key facts and metrics
- Company Name: Apple
- Market Cap: $3.759 T
- Revenue (TTM): $404.819B
- Net Income (TTM): $112.07B
- 1-year Trailing Total Return: -7.38%
- Exchange: NASDAQ
- Year Founded: 1976
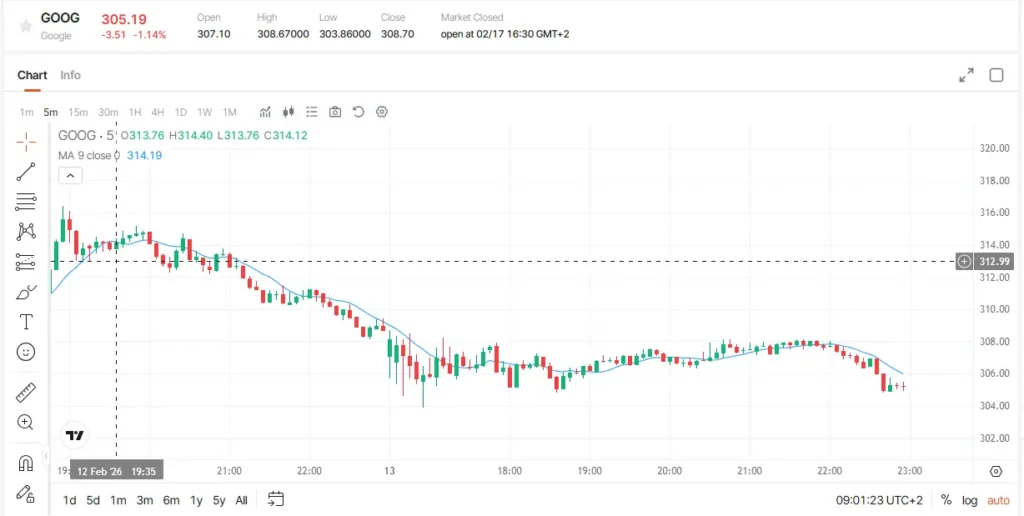
#3 Alphabet (Google) (GOOG)
Business summary
Alphabet earns most revenue from ads in Search, YouTube, and its ad network. Ad pricing and volume move with the economy and marketing budgets. YouTube adds growth from video ads and paid subscriptions. Google Cloud is a key swing factor as firms shift workloads and AI tools. Watchout for how AI changes search and how it affects clicks and ad costs. Key risks are downturns in ad, rule action, and the rising costs of running AI.
Key facts and metrics
- Company Name: Alphabet (Google)
- Market Cap: $3.701 T
- Revenue (TTM): $402.836B
- Net Income (TTM): $132.17B
- 1-year Trailing Total Return: 63.51%
- Exchange: NASDAQ
- Year Founded: 1998
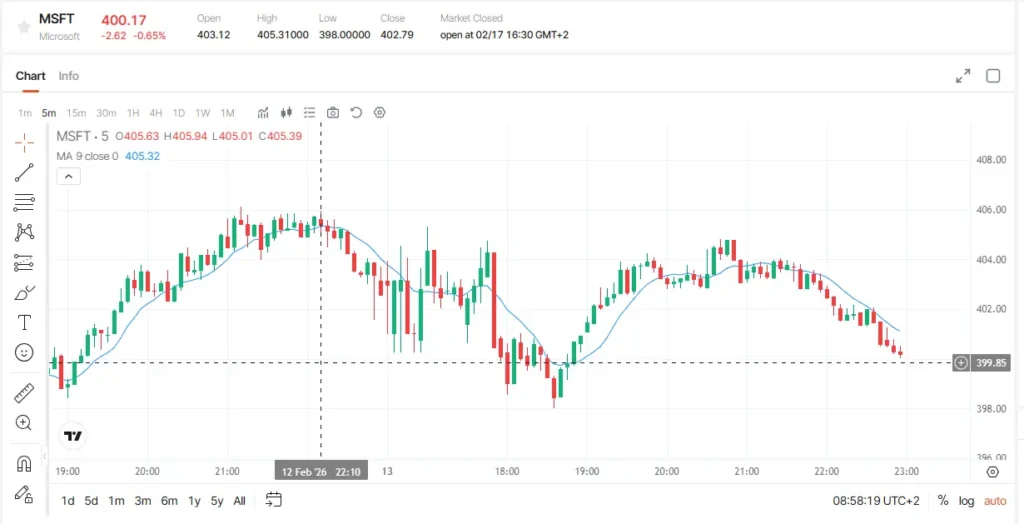
#4 Microsoft (MSFT)
Business summary
Microsoft sells business software, cloud services, and tools for developers. Azure growth tracks cloud budgets and new AI build-outs. Office and Windows bring steady cash from subscriptions and upgrades. Its partner network helps it win large deals and expand accounts.
We can keep watch on AI add-ons like Copilot and how fast customers pay for seats. Key risks are cloud price pressure, slower IT spend, and rule probes.
Key facts and metrics
- Company Name: Microsoft
- Market Cap: $2.982 T
- Revenue (TTM): $305.453B
- Net Income (TTM): $119.262B
- 1-year Trailing Total Return: -1.52%
- Exchange: NASDAQ
- Year Founded: 1975
#5 Amazon (AMZN)
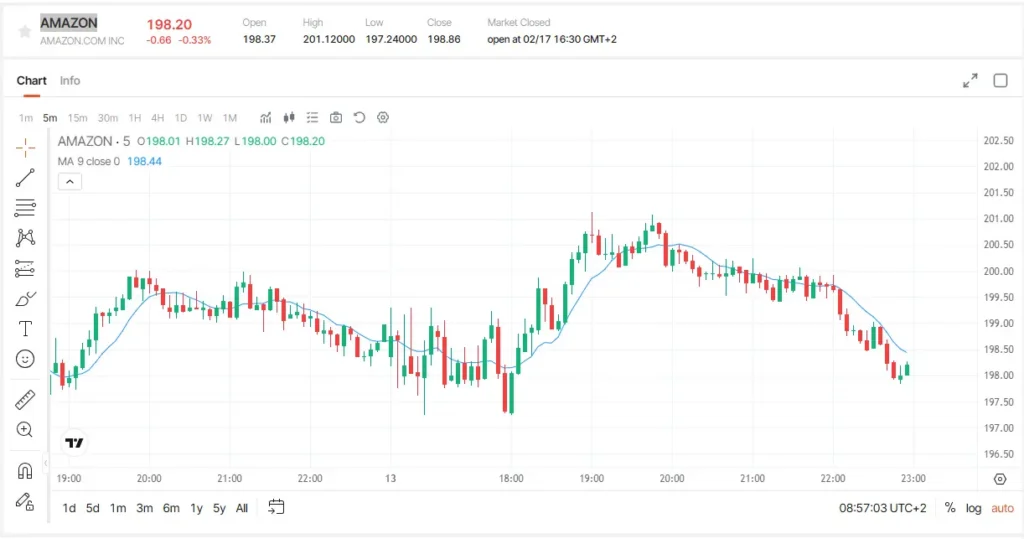
Business summary
Amazon runs a global online store, but AWS drives most operating profit. Retail margins depend on shipping costs, ads, and third-party seller fees.AWS growth tracks demand for cloud, data, and AI workloads. Store ads add high-margin revenue as brands bid for clicks.
Keep an eye on the cost controls, delivery speed gains, and AI spending at AWS.Key risks are wage and fuel costs, rule action, and tougher cloud rivals.
Key facts and metrics
- Company Name: Amazon
- Market Cap: $2.133 T
- Revenue (TTM): $716.924B
- Net Income (TTM): $77.67B
- 1-year Trailing Total Return: -13.71%
- Exchange: NASDAQ
- Year Founded: 1994
#6 TSMC (TSM)
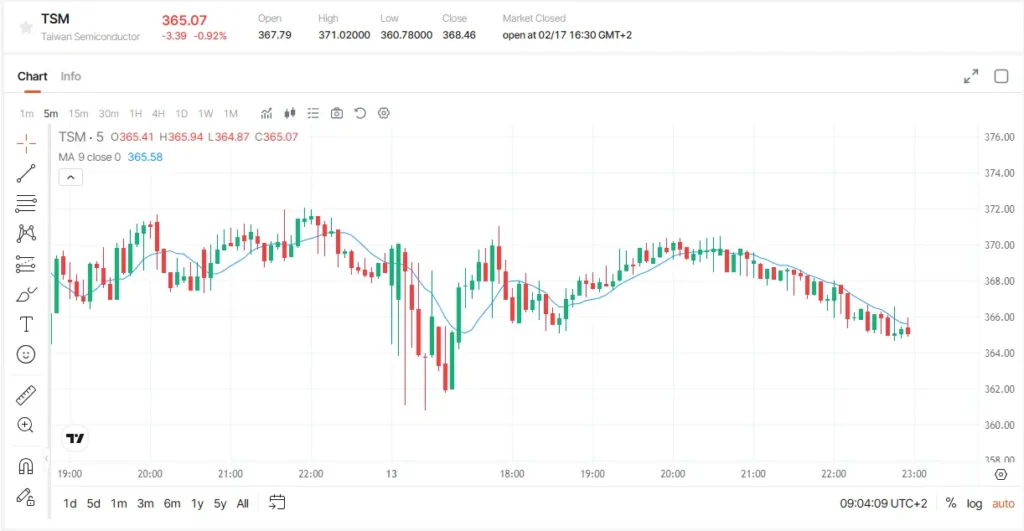
Business summary
TSMC makes advanced chips for top phone, PC, and AI customers. It wins with process lead, scale, and high yields at small nodes. Demand swings with the chip cycle and big device launch seasons. AI servers and high-end compute are the main near-term drivers. Keep a watch on capex plans, node ramps, and large customer order trends. Key risks are geo tension, supply shocks, and heavy spending needs.
Key facts and metrics
- Company Name: TSMC
- Market Cap: $1.900 T
- Revenue (TTM): $121.411B
- Net Income (TTM): $54.706B
- 1-year Trailing Total Return: 90.47%
- Exchange: NYSE
- Year Founded: 1987
#7 Saudi Aramco (2222.SR)
Business summary
Saudi Aramco produces oil and gas at very low cost from giant fields. Cash flow tracks crude prices and global demand growth. It also runs refining and chemicals to sell fuels and other products. Dividends are central to the story and a big part of total return. It is an important requirement to keep watch and track OPEC+ output moves, China’s demand, and spending related to new oilfield expansion. Key risks are price drops, policy shifts, and long-term energy change.
Key facts and metrics
- Company Name: Saudi Aramco
- Market Cap: $1.651 T
- Revenue (TTM): $461.272B
- Net Income (TTM): $95.59B
- 1-year Trailing Total Return: -2.98%
- Exchange: Tadawul (Saudi Exchange)
- Year Founded: 1933
#8 Meta Platforms
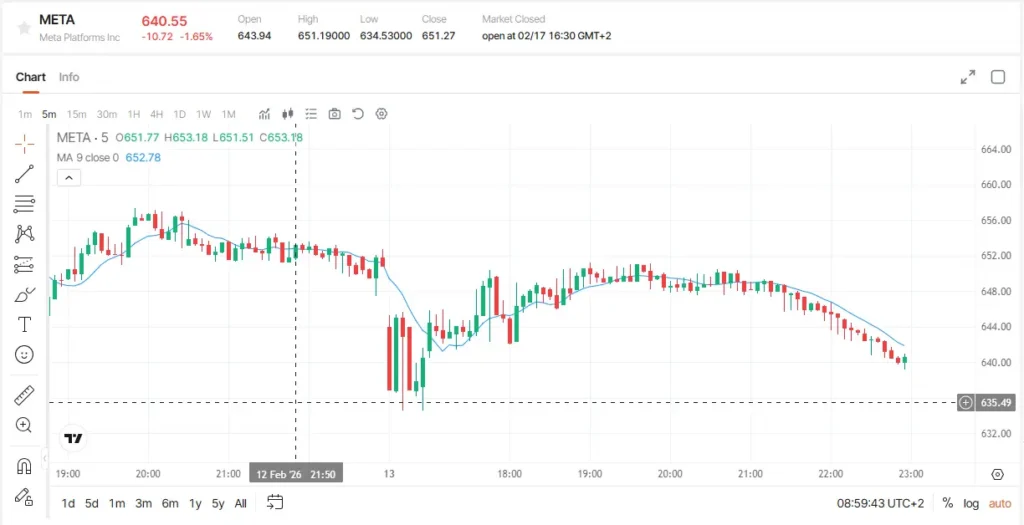
Business summary
Meta earns most revenue from ads across Facebook, Instagram, and Reels. Ad demand follows business spend, while user time sets ad supply. WhatsApp and Messenger add reach and new paths to sell tools. AI improves ranking and targeting, which can lift ad pricing. Watch Reels payback, ad load growth, and new paid messaging plans. Key risks are rule action, privacy limits, and heavy Reality Labs losses.
Key facts and metrics
- Company Name: Meta Platforms
- Market Cap: $1.618 T
- Revenue (TTM): $169.664B
- Net Income (TTM): $73.202B
- 1-year Trailing Total Return: 24.39%
- Exchange: NASDAQ
- Year Founded: 2004
#9 Tesla (TSLA)
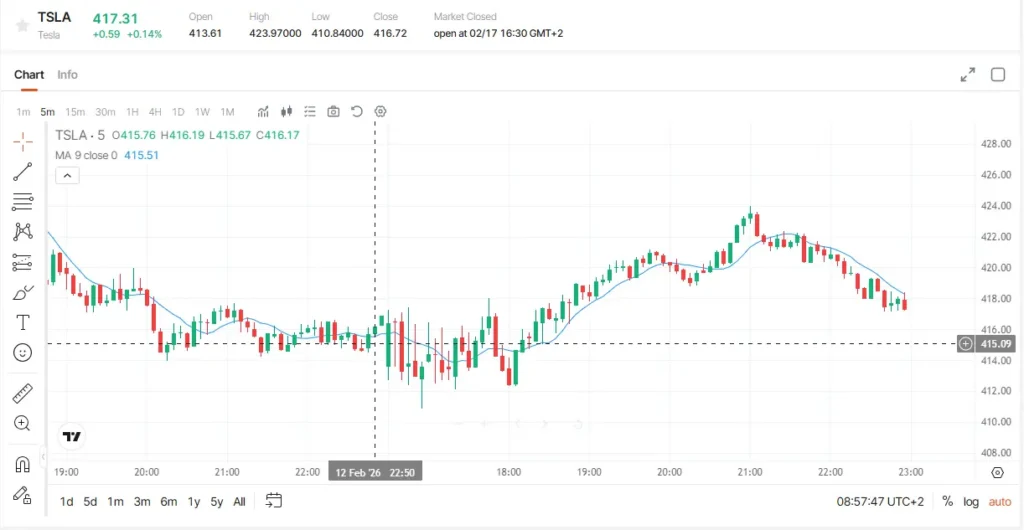
Business summary
Tesla sells electric cars, but pricing and volume drive near-term results. Auto gross margin is the key line investors watch each quarter. Energy storage is growing and can reduce swings from the car cycle. Software revenue matters, but timing depends on features and approvals. Watch China and U.S. demand, factory output, and new model ramps. Key risks are price wars, weak demand, and strict rules on autonomy.
Key facts and metrics
- Company Name: Tesla
- Market Cap: $1.566 T
- Revenue (TTM): $107.877B
- Net Income (TTM): $9.178B
- 1-year Trailing Total Return: -2.65%
- Exchange: NASDAQ
- Year Founded: 2003
#10 Broadcom (AVGO)
Business summary
Broadcom sells chips for networking, storage, and wireless devices. AI data centers drive demand for their networking parts and custom silicon. Its software unit adds steady cash from large enterprise customers. This mix can support margins and cash flow through chip cycles. Watch large customer orders, AI capex trends, and software renewals. Key risks are handset swings, customer concentration, and deal execution.
Key facts and metrics
- Company Name: Broadcom
- Market Cap: $1.541 T
- Revenue (TTM): $57.388B
- Net Income (TTM): $13.948B
- 1-year Trailing Total Return: 103.75%
- Exchange: NASDAQ
- Year Founded: 1961
Top 10 JSE Companies by Market Cap(2026)
Notes: Market Cap and 1Y Return are taken from the JSE market-cap ranking page. Revenue (TTM) and Net Income (TTM) are taken from each company profile (shown as Revenue (TTM) and Earnings (TTM)).
1. Gold Fields Limited (JSE: GFI)
Gold Fields is a global gold producer with mines in several regions. It runs mining and processing sites and sells gold into world markets. Results often track gold prices, output levels, and operating costs. The company funds exploration and new projects to extend mine life. Safety, energy, water, and community work shape daily operations.
- Company Name: Gold Fields Limited
- Market Cap: R776.4b
- Revenue (TTM): R104.54b
- Net Income (TTM): R30.03b
- 1-year Trailing Total Return: 153.5%
- Exchange: JSE
- Year Founded: 1887
2. Naspers Limited (JSE: NPN)
Naspers is a consumer internet group with global platform exposure. It has acquired and owned stakes in digital firms across payments, classifieds, and e-commerce. Value can swing with portfolio moves and capital allocation choices. It aims to build value through long-term ownership and active support. It also has a legacy media and publishing footprint.
- Company Name: Naspers Limited
- Market Cap: R688.8b
- Revenue (TTM): R125.57b
- Net Income (TTM): R91.87b
- 1-year Trailing Total Return: -4.6%
- Exchange: JSE
- Year Founded: 1915
3. Capitec Bank Holdings Limited (JSE: CPI)
Capitec has narrowed its focus to retail banking and everyday financial products. It serves clients through several branches and has a strong mobile banking app. It offers card payments, savings, and consumer lending products.
Growth depends on deposits, loan demand, and credit losses. Cost control and digital scale are core to its approach.
- Company Name: Capitec Bank Holdings Limited
- Market Cap: R541.4b
- Revenue (TTM): R39.33b
- Net Income (TTM): R15.31b
- 1-year Trailing Total Return: 51.3%
- Exchange: JSE
- Year Founded: 1999
4. FirstRand Limited (JSE: FSR)
FirstRand is a major financial group serving retail and corporate clients. Its earnings come mainly from lending, fees, payments, and related financial services. Funds earned from the services are further invested in digital channels while managing risk and capital. It also runs investment and insurance-linked offerings across different market segments.
- Company Name: FirstRand Limited
- Market Cap: R535.3b
- Revenue (TTM): R132.81b
- Net Income (TTM): R41.88b
- 1-year Trailing Total Return: 30.4%
- Exchange: JSE
- Year Founded: 1966
5. Standard Bank Group Limited (JSE: SBK)
Standard Bank provides banking services across South Africa and beyond. It serves retail, business, and corporate clients with a broad range of products. Trade finance and transaction banking are key parts of the franchise. Earnings depend on credit growth, funding costs, and impairments. Digital banking and platform upgrades remain a major focus.
- Company Name: Standard Bank Group Limited
- Market Cap: R510.8b
- Revenue (TTM): R172.66b
- Net Income (TTM): R46.07b
- 1-year Trailing Total Return: 44.3%
- Exchange: JSE
- Year Founded: 1862
6. Valterra Platinum Limited (JSE:VAL)
Valterra produces platinum group metals and related base metals. It mines, processes, and sells refined output to global buyers. Performance often swings with PGM prices and operating stability. Power, input costs, and mining conditions can shift margins fast. It manages long-cycle capital plans tied to industrial demand trends.
- Company Name: Valterra Platinum Limited
- Market Cap: R386.4b
- Revenue (TTM): R99.11b
- Net Income (TTM): R1.32b
- 1-year Trailing Total Return: 122.7%
- Exchange: JSE
- Year Founded: 1946
7. MTN Group Limited (JSE: MTN)
MTN runs mobile networks across Africa and parts of the Middle East. It sells voice, data, and enterprise connectivity services at scale. Its fintech arm offers mobile money, payments, and other services. Growth depends on data demand, FX moves, and local regulation. Network investment and spectrum access shape quality and margins.
- Company Name: MTN Group Limited
- Market Cap: R357.1b
- Revenue (TTM): R206.75b
- Net Income (TTM): R7.54b
- 1-year Trailing Total Return: 73.8%
- Exchange: JSE
- Year Founded: 1994
8. Vodacom Group Limited (JSE:VOD)
Vodacom provides mobile and fixed connectivity services in its markets. It sells voice, data, broadband, and enterprise network solutions. It also expands digital and financial services where conditions fit. Results track subscriber trends, data usage, and network spending. Competition and regulation can affect pricing and cash returns.
- Company Name: Vodacom Group Limited
- Market Cap: R304.7b
- Revenue (TTM): R160.27b
- Net Income (TTM): R18.86b
- 1-year Trailing Total Return: 33.4%
- Exchange: JSE
- Year Founded: 1993
9. Impala Platinum Holdings Limited (JSE: IMP)
Impala is a major miner and refiner of platinum group metals. It produces PGMs and by-products sold into auto and industry markets. Earnings depend on PGM prices, grades, and operating cost control. Power, labour, and safety issues can shift output and costs quickly. It invests in sustaining capital to keep mines productive over time.
- Company Name: Impala Platinum Holdings Limited
- Market Cap: R244.4b
- Revenue (TTM): R85.46b
- Net Income (TTM): R761.00m
- 1-year Trailing Total Return: 167.4%
- Exchange: JSE
- Year Founded: 1957
10. Absa Group Limited (JSE:ABG)
Absa provides banking and financial services across South Africa and beyond. It serves retail and business clients, plus corporate and investment banking. It also offers insurance, wealth products, and advisory-related services. Results are driven by credit losses, funding costs, and loan demand. Digital banking spend supports scale and service improvements.
- Company Name: Absa Group Limited
- Market Cap: R220.2b
- Revenue (TTM): R99.45b
- Net Income (TTM): R22.92b
- 1-year Trailing Total Return: 40.8%
- Exchange: JSE
- Year Founded: 1986
Top 10 Largest African Stock Exchanges by Market Cap (As of Feb 2026)
This section comprises a list of the top 10 largest stock exchanges in Africa by total market capitalisation, using compiled year-end 2025 market data.
The ranking reflects the most recent continent-wide data that was available in February 2026. Primary source for the ranking and one-year index returns is from Daba Finance (The Largest African Stock Exchanges in 2025).
Market capitalisation here means the total market value of listed shares on each exchange, expressed in US dollars. The one-year figure shown is the broad market index return in USD terms, as reported by the same source. It should be noted that this is for general education and reference purposes only. It is not personal investment advice.
Method and Notes
Market-cap figures and index returns come from a single compiled ranking. The values are rounded for readability. Some exchanges publish domestic-only market cap figures through global bodies such as the World Federation of Exchanges. These may differ from total figures that include foreign listings. Financial statement figures for stock exchange operators are not consistently available across all markets.
For this reason, revenue (TTM) and net income (TTM) are marked as not comparable where public TTM data is not readily available.
Ranked list (Top 10)
| Rank | Exchange | Country/Region | Market Cap(USD) | 1-year index return (USD) |
| 1 | Johannesburg Stock Exchange (JSE) | South Africa | US$1.46 trillion | +56.7% (broad index, USD terms) |
| 2 | Casablanca Stock Exchange (Bourse de Casablanca) | Morocco | US$114.2 billion | +41.5% (MASI, USD terms) |
| 3 | Nigeria Exchange(NGX) | Nigeria | US$68.8 billion | +60.6% (NGX ASI, USD terms) |
| 4 | Egyptian Exchage(EGX) | Egypt | US$62.9 billion | +49.4% (EGX 30, USD terms) |
| 5 | Botswana Stock Exchange (BSE) | Botswana | US$56.3 billion | +14.8% (BSE DCI, USD terms) |
| 6 | BRVM (Bourse Régionale des Valeurs Mobilières) | West Africa (regional market) | US$23.9 billion | +41.8% (BRVM Composite, USD terms) |
| 7 | Nairobi Securities Exchange (NSE) | Kenya | US$22.8 billion | +51.5% (NSE ASI, USD terms) |
| 8 | Malawi Stock Exchange (MSE) | Malawi | US$18.7 billion | +248.0% (MSE ASI, USD terms) |
| 9 | Ghana Stock Exchange (GSE) | Ghana | US$16.4 billion | +149.7% (GSE-CI, USD terms) |
| 10 | Tunis Stock Exchange (BVMT) | Tunisia | US$11.8 billion | +49.2% (TUNINDEX, USD terms) |
Disclaimer: The market capitalisation figures and rankings provided above are for educational and informational purposes only. They are based on publicly available sources and may change frequently due to market price movements, share issuance, or other factors. The broker does not guarantee the accuracy, completeness, or timeliness of this information. This content does not constitute investment advice, recommendation, or an inducement to trade, and should not be relied upon for investment decisions. Always refer to official exchange publications and verify data independently.
Frequently Asked Questions
Which sectors contribute most to the JSE’s market capitalisation?
A big share comes from resources/basic materials and large global consumer/industrial groups, because many top listings sit there. Financials also matter a lot, since major banks like Capitec, FirstRand, and Standard Bank are among the biggest by market cap.
Show me the largest companies by market cap on the Johannesburg Stock Exchange?
By market cap, the biggest JSE listings include BHP (R2.93T), AB InBev (R2.35T), British American Tobacco (R2.07T), Prosus (R1.99T), Richemont (R1.96T), Glencore (R1.27T), AngloGold Ashanti (R875B), Anglo American (R843B), Gold Fields (R786B), and Naspers (R696B). Rankings move as prices move, so this list can change day to day.
What is the market capitalisation of the Johannesburg Stock Exchange?
The JSE’s total equity market cap was about R24,405 billion (≈ R24.4 trillion) for the week ended 6 Feb 2026. This figure is the combined value of listed shares.
What does market capitalisation mean?
Market capitalisation is the total market value of a company’s shares. It’s a quick way to size a listed company.
How do you calculate the market capitalisation of a company?
Use: market cap = share price × shares outstanding. If the share price moves, the market cap moves too.
How do I check the market capitalisation of JSE-listed companies?
Use a market-data table that lists JSE shares sorted by market cap (then search the company name or ticker). For example, StockAnalysis shows JSE stocks with market caps in ZAR and updates the list often.
Why does market capitalisation change daily?
It changes mainly because the share price changes with trading. It can also change when the share count changes (buybacks, new shares, splits).
RISK WARNING: CFDs are complex financial instruments and carry a high risk of losing money rapidly due to leverage. You should ensure you fully understand the risks involved and carefully consider whether you can afford to take the high risk of losing your money before trading.
Disclaimer: The information is provided for educational purposes only and doesn’t take into account your personal objectives, financial circumstances, or needs. It does not constitute investment advice. We encourage you to seek independent advice if necessary. The information has not been prepared in accordance with legal requirements designed to promote the independence of investment research. No representation or warranty is given as to the accuracy or completeness of any information contained within.
This material may contain historical or past performance figures and should not be relied on. Furthermore, estimates, forward-looking statements, and forecasts cannot be guaranteed. The information on this site and the products and services offered are not intended for distribution to any person in any country or jurisdiction where such distribution or use would be contrary to local law or regulation.
References
- https://www.investopedia.com/terms/m/marketcapitalization.asp Market Capitalization: What it Means for Investors
- https://ng.investing.com/pro/JSE:JSE/explorer/marketcap JSE Market Cap
- https://www.jse.co.za/learn-how-to-invest/accessing-market/market-capitalisation Market Capitalization
- https://www.investopedia.com/terms/s/stocksplit.asp? What is A Stock Split
- https://www.investopedia.com/ask/answers/09/stock-delist.asp. Delisting Stocks: Rules and Criteria
- https://www.finra.org/investors/insights/market-cap. Why Market Cap Matters?
- https://www.investopedia.com/terms/l/large-cap.asp Meaning of Large Market Cap
- https://www.investopedia.com/terms/m/midcapstock.asp Meaning of Mid-cap
- https://www.dabafinance.com/en/insights/the-largest-african-stock-exchanges-in-2025-by-market-capitalization Daba Finance. “The Largest African Stock Exchanges in 2025.” January 13, 2026.
- https://group.jse.co.za/group-overview/history JSE. “History.”
- https://sseinitiative.org/stock-exchange/casablanca_bourse SSE Initiative. “Casablanca Stock Exchange.”
- https://ngxgroup.com/about/ NGX Group. “About.”
- https://www.egx.com.eg/en/History.aspx EGX. “History.”
- https://www.bse.co.bw/history/ Botswana Stock Exchange. “History.”
- https://www.african-markets.com/en/stock-markets/brvm/about African Markets. “BRVM: About.”
- https://www.nse.co.ke/about-nse/ Nairobi Securities Exchange. “About NSE.”
- https://mse.co.mw/about-us/background Malawi Stock Exchange. “Background.”
- https://gse.com.gh/ Ghana Stock Exchange. Official website.
- https://www.bvmt.com.tn/en-gb/content/presentation Bourse de Tunis (BVMT). “Presentation.”
- https://focus.world-exchanges.org/issue/february-2026/market-statistics World Federation of Exchanges. “Focus Market Statistics (issue page).”