
Introduction
If you’ve ever searched how to trade CPI news, chances are you’ve already felt its impact, and not in a good way.
Maybe a USD/JPY spike blew past your stop-loss in seconds. Or the S&P 500 surged unexpectedly, all because Core CPI printed lower than forecast. That’s the reality of trading inflation data: one number, and the entire market shifts.
In this guide, you’ll learn exactly how to trade CPI news with confidence, from decoding Core CPI vs PPI to anticipating market reactions before they unfold.
(For a broader view of economic data trading, check out our comprehensive guide on inflation and interest rates for additional insights.)
The goal of this all-important guide is to educate you on:
- The difference between Core CPI and PPI
- Key Considerations When Trading During CPI Releases
- Real chart examples from recent CPI and PPI events
- Common strategies observed among experienced traders
- The tools, calendars, and checklists you need to stay ahead
First, let’s lay the foundation.
How to Trade CPI News: Understand the Core Concepts First

Before you can gain any useful insights from CPI or PPI news, you need to understand exactly what these numbers represent and why they trigger such violent market moves.
What Is CPI?
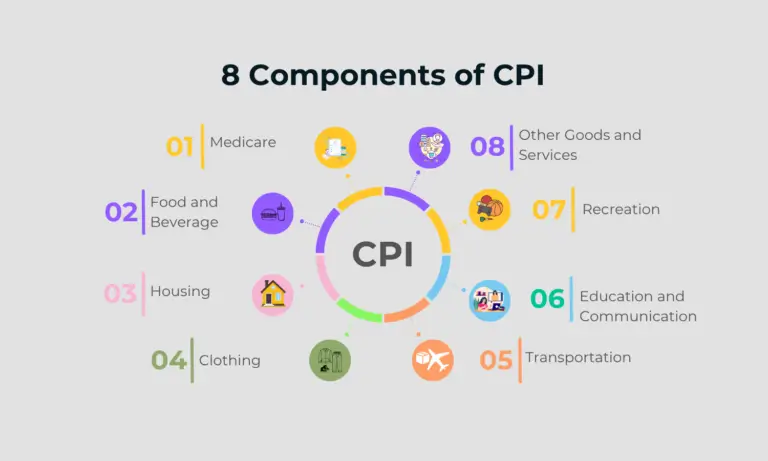
The Consumer Price Index (CPI) is a monthly report released by government agencies (such as the U.S. Bureau of Labour Statistics) that measures changes in the price level of a basket of goods and services commonly purchased by households.
There are 2 major forms:
- Headline CPI: This includes all items, including food and energy
- Core CPI: It excludes food and energy because of their volatility, providing a clearer picture of long-term inflation
Most traders focus on Core CPI YoY (year-over-year) and MoM (month-over-month) figures, as the Federal Reserve closely watches them when making rate decisions.
CPI Release Time: In the U.S., the CPI data is typically released monthly at 8:30 AM EST. This time has been observed to be the most volatile moment on the trading calendar.
In South Africa, CPI release times are generally announced by Statistics South Africa within the second week of the month following the month under reference.
For example, the March CPI will be released in the second week of April. The CPI data for Nigeria is typically released by the National Bureau of Statistics. The actual release date is available on nigerianstat.gov.ng
How CPI Affects the Market
- Forex: A higher-than-expected CPI often leads to a stronger USD, as markets price in potential rate hikes. (e.g., NFP forex traders often use CPI data to confirm USD direction.)
- Stocks: High inflation tends to hurt growth stocks (like tech), while easing CPI can trigger rallies.
- Commodities: Gold tends to move inversely to rate-hike expectations, so a hot CPI print could trigger a drop.
Example: In July 2025, when Core CPI came in above forecast (0.4% MoM vs. 0.2% expected), USD/JPY spiked nearly 90 pips in minutes, while Nasdaq futures dropped.
What Is PPI and Why Does It Matter?
The Producer Price Index (PPI) measures the average change in selling prices received by domestic producers. It often precedes CPI trends, as producer costs can eventually be passed on to consumers.
There are two key PPI metrics:
- Final Demand PPI
- Core PPI (ex food and energy)
Although PPI doesn’t always move the market as strongly as CPI, sharp surprises in PPI can signal CPI direction for the following month, giving traders a first-mover advantage.
CPI vs PPI: Which One Moves the Market More?
Here’s the quick breakdown:
| Metric | Market Impact | Why It Matters |
| CPI | Very high | Direct link to the interest rate |
| Core CPI | Highest | US Fed’s preferred inflation view |
| PPI | Medium | Leading inflation indicator |
Chart 3: Showing CPI, Core CPI, PPI, and the impact on the market. Chart is for educational purposes only.
We’ll dive deeper into the CPI–PPI relationship in the next section and explore how to use them side-by-side for sharper trade entries and forecasts.
But first, ensure that your news calendar is up to date. Set an alert for CPI every second week of the month at 8:30 AM EST.
The market doesn’t wait.
Core CPI vs PPI: Which Report Actually Moves the Market?
When inflation numbers hit the screen, traders react, and the reaction is instant. But not all inflationary reports are created equal.
If you aim to trade CPI news effectively and truly understand the market’s pulse, you need to thoroughly grasp how CPI and PPI differ, and more importantly, which one moves prices more.
CPI (Consumer Price Index): The Market’s Favourite
CPI, especially Core CPI, is widely regarded as the most important inflation metric affecting the global trading community. It reflects the price changes consumers feel, including housing, healthcare, transport, and apparel.
When the CPI spikes unexpectedly, traders anticipate that the Federal Reserve might raise rates more quickly, which instantly strengthens the U.S. dollar and negatively impacts interest-sensitive assets, such as tech stocks and gold.
Start trading CPI News with Vantage Markets
Real Impact:
- In May 2024, a surprise Core CPI of 0.4% (vs 0.2% expected) led to a 75-pip surge in USD/JPY and a 1.3% drop in NASDAQ futures within minutes.
- Forex pairs like EUR/USD, GBP/USD, and XAU/USD tend to react sharply, and volatility often peaks within the first 15–30 minutes after the release.
This is why understanding how to trade CPI news isn’t just about timing; it’s about understanding the market’s inflation psychology.
PPI (Producer Price Index): The Sneaky Early Signal
PPI tracks the price change in goods sold by producers before they reach consumers.
It’s considered a leading indicator; if producer prices rise sharply, consumer prices often follow a few weeks later.
While PPI doesn’t create the same instant market fireworks as CPI, savvy traders watch it closely to forecast CPI surprises and position early.
Case in Point:
In January 2025, PPI Final Demand YoY increased by 1.5% compared to the expected 1.1%. Traders took it as a clue that CPI would follow, and they were right. CPI rose sharply the following month, confirming the early signal from PPI. By reading PPI correctly, some traders had already taken a long position on the dollar before the CPI release, giving them a first-mover advantage.
Side-by-Side: Core CPI vs PPI Impact Table
| Aspect | Core CPI(Consumer Price Index) | PPI(Producer Price Index) |
| Definition | Measures the average price paid by consumers, excluding food and energy | Measure the average price change received by producers, including raw goods |
| Release authority | U.S. Bureau of Labour Statistics(BLS) | U.S. Bureau of Labour Statistics (BLS) |
| Release Frequency | Monthly | Monthly |
| Release Time | Usually 13th – 15th of every month at 8:30 AM EST | Usually 8th – 13th of every month at 8:30 AM EST |
| Market Focus | Closely watched by the Fed, Investors and retail traders | Closely watched by the Fed, Investors, and retail traders |
| Volatility Impact | High – Can cause a strong immediate reaction | Moderate – Less reaction but strong as a leading indicator |
| Trader Attention | The primary focus of news traders and macro strategists | Secondary. Used mostly for inflation forecasting |
| Common Asset Reaction | USD Spikes, Gold dips, NASDAQ drops on hot CPI | Less immediate but can signal shifts in the above before CPI confirms |
| Core Focus Areas | Shelter, Medical care, and services inflation | Less immediate, but can signal shifts in the above before CPI confirms |
| Raw materials, energy inputs, and goods manufacturing | Used for real-time inflation tracking and policy expectations | Used to anticipate future CPI trends |
| Examples of Impact | July 2025: +0.4% Core CPI → USD/JPY jumped 90 pips | Jan 2025: Hot PPI →CPI surprised higher in Feb |
| Market Timing Strategy | Ideal for short-term and intraday strategy | Ideal for positioning ahead of CPI or detecting inflation trends early |
For the above chart, below are the Sources and Methodological References:
Sources:
Bureau of Labour Statistics – PPI FAQ
Bureau of Labour Statistics – CPI Methodology
Comparative Analysis of CPI and PPI
These comparisons are based on official BLS publications and expert consensus in macroeconomic analysis. For deeper insights, visit the Bureau of Labour Statistics website or follow market commentary on platforms such as Bloomberg, Investing.com, or the Federal Reserve Economic Data (FRED) portal.
So, Which One Should You Focus On?
If you’re a short-term trader:
Focus on Core CPI. It consistently triggers the biggest moves, especially on USD pairs and equity indices.
If you’re a swing trader or macro strategist:
Watch PPI to get ahead of CPI trends. Combine both for layered insights.
Some traders monitor PPI surprises ahead of CPI releases to gauge potential market reaction, though this carries risks and should be approached cautiously.
In the next section, we’ll show you how to build a pre-release checklist that prepares you to trade CPI news with clarity, not chaos.
How to Trade CPI News: Pre-Release Checklist
Trading CPI news isn’t just about reacting to numbers; it’s about preparing with precision. The hours leading up to the CPI release can make or break the trade. A well-structured pre-release checklist helps you stay focused, manage risk, and avoid impulsive decisions driven by volatility. Here’s what experienced traders often consider before the CPI hits the wires.
1. Know the Release Date and Time
The U.S. Core CPI report is typically released on the second, third, or fourth Tuesday of each month at 8:30 AM Eastern Time.
You can confirm this via:
Set alerts 1 hour and 15 minutes before release time. This gives you enough lead time to prep without rushing.
Tip: If PPI is released before CPI (which is often the case), review it as an early signal. A hotter-than-expected PPI sometimes foreshadows a surprise in CPI.
2. Review Forecast vs Previous Numbers
Before the release, focus on these three important numbers:
- Previous Core CPI YoY / MoM
- Forecast Core CPI YoY / MoM
- Your country/region’s recent inflation trend
Here’s how traders interpret the setup:
- If the forecast is higher than the previous one, markets may already be pricing in inflationary fears.
- If the forecast is lower, a hot surprise can cause a stronger reaction.
You’re not predicting the number, you’re analysing market positioning around expectations.
3. Check Market Sentiment and Pre-Move Trends
Markets often pre-position hours before CPI releases:
- Is the USD index trending higher or consolidating?
- Are U.S. bond yields elevated or falling?
- Is gold showing hesitation or trending strongly?
These subtle shifts can hint at how traders are positioning for CPI and help you adjust expectations, not make commitments. When USD/JPY rallies aggressively ahead of a U.S. CPI release, it often reflects traders’ anticipation of a hotter inflation reading, driven by yield expectations and interest rate differentials.
However, according to FXStreet, such momentum may be vulnerable to reversal if CPI disappoints:
“USD/JPY rises above 147.00 as investors look ahead to… US Consumer Price Index release”
Additionally, analysis from City Index states that if inflation data misses forecasts, it can lead to a sharp reversal in the pair, even after sustained bullish movement:
“USD/JPY is testing a logical support zone… a rebound if we see an as‑expected or hotter‑than‑expected inflation reading”
4. Reduce Exposure and Avoid Over-Leveraging
Even when well-prepared, CPI releases often cause widened spreads, slippage, and fake-outs. Many traders reduce position size or wait for the initial spike to settle before acting. This is not about avoiding the trade; it’s about acknowledging that news trades carry unique execution risk. It’s important to note that even experienced traders may face significant execution risks during CPI events, including slippage and widened spreads. These conditions may lead to outcomes different from intended trades.
You can also:
- Mark key levels of support/resistance on the 15M/1H charts
- Use alerts instead of live entries if you’re not used to high-speed volatility.
5. Prepare Your Tools
Make sure these are in place:
- Updated calendar alerts (Forex Factory, Investing.com)
- Clean chart setups with levels drawn (support, resistance, trendlines)
- Risk calculator to determine trade size
- Auto-screenshot tool (if journaling trades)
- Live news feed, if available (some traders use Twitter or Bloomberg terminals.
Even if you don’t trade it live, this can offer an insightful opportunity to observe how markets respond to economic data. Now that the preparation is clear, let’s talk about what matters when the numbers drop:
How to trade CPI news on release, without getting trapped in the chaos.
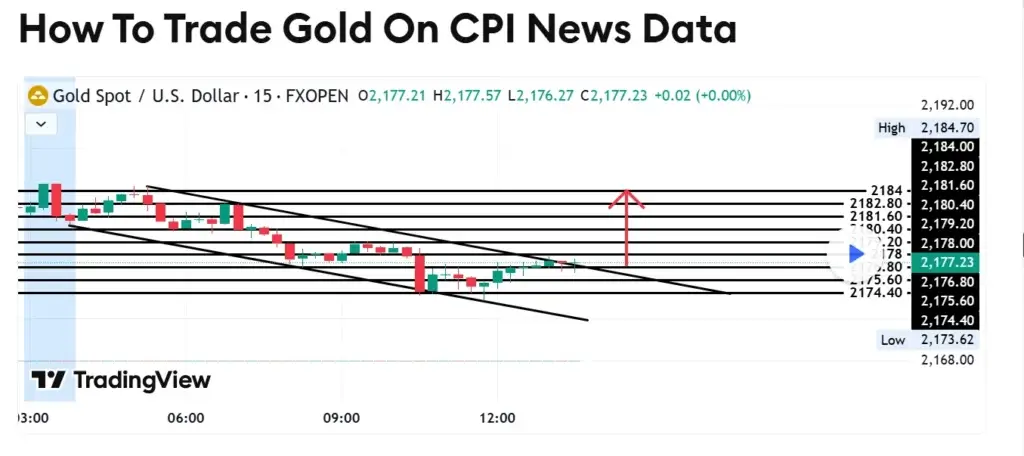
How to Trade CPI News on Release: Entry Strategies That Work
The moment CPI news hits the wire, markets don’t wait. Within seconds, price action can spike, reverse, or trend with unusual speed. This is where the real game begins. Whether you’re a short-term scalper or a cautious macro trader, understanding the typical reactions and crafting a data-backed plan can help you navigate CPI volatility without getting caught in emotional trades.
1. Expect Instant Volatility, Not Instant Direction
When the CPI release hits at 8:30 AM EST, platforms light up with movement. But here’s the catch: the initial move isn’t always the real move.
Markets often:
- Spike in one direction, then quickly reverse (stop-hunt behaviour)
- Experience whipsaws for the first 1–3 minutes.
- Only trend steadily after digesting the data fully
This is why some traders choose to wait out the first 3–5 minutes, allowing time for the market to reveal its hand before entering.
2. Common CPI Trading Setups
Note: The strategies discussed are provided for educational and illustrative purposes only. They do not constitute trading advice.
a. Straddle Breakout Strategy (Advanced)
Before release:
- Place two pending orders above and below key levels (resistance & support)
- Use a tight stop and predefined take profit.
- One side triggers; the other cancels
Caution: During major CPI surprises, spreads can widen, and slippage may cause poor execution. This strategy is high-risk and suitable only for well-tested systems.
b. Post-Spike Reversal Strategy (Conservative)
After the spike:
- Wait for initial direction to exhaust (on the 1–5 minute chart)
- Look for a strong wick + momentum shift.
- Enter on confirmation candle with small risk.
This strategy takes advantage of market overreaction, often common when CPI is close to forecast but surprises traders with context (e.g., rising shelter inflation despite overall CPI falling).
c. Trend Continuation Setup (Macro Bias)
If CPI matches a broader inflation narrative (e.g., disinflation trend continuing):
- Wait for the price to break a swing high/low.
- Enter on the retest or breakout candle.
- Use wider stop-loss and target multiple R multiples (2R or 3R)
Example: Data from Reuters showed that:
“In April 2025, the U.S. CPI printed 2.3% YoY, slightly under the 2.4% forecast, prompting risk-on sentiment across markets. In currency markets, EUR/USD appreciated about 0.4%, moving toward recent highs as USD weakened on the softer inflation print.”
This strategy works best when the CPI print reinforces the current macro trend.
3. Risk Considerations
- Slippage: Price may jump beyond your entry before the trade is filled. Use limit orders where supported.
- Spreads: Expect widened spreads right before and after the release.
- Fakeouts: Don’t assume the first candle direction is the final move.
- Latency: Fast execution matters; slower brokers may hurt your strategy.
Rather than chasing moves, observe the structure and let the market settle before committing capital, especially if your style isn’t built for speed trading.
Tools That Can Help at This Stage
- Tick charts or 1-minute charts: For faster reaction monitoring
- TradingView alerts: To avoid sitting in front of the screen too early
- Volatility overlays (e.g., ATR): To set wider stop-loss logic
News squawk feeds: Instant audio updates as CPI drops.
How do CPI and PPI affect specific asset classes such as forex, stocks, and commodities?
Let’s break it down.
How CPI and PPI Affect Forex, Stocks, and Commodities
Inflation reports like CPI and PPI don’t just move one asset class; they send shockwaves through the entire market ecosystem, including the global financial markets. However, not every asset reacts the same way. Let’s explore how each market typically responds to CPI and PPI news, and how traders interpret those moves based on economic expectations, surprise factors, and policy implications.
Forex: The Most Immediate Reaction
CPI tends to trigger instant moves in major currency pairs, especially those involving the U.S. dollar.
| CPI Outcome | USD Reaction | Currency Pair Impact |
| CPI higher than forecast | USD strengthens (rate hike expectation) | USD/JPY up, EUR/USD down |
| CPI lower than forecast | USD weakens(rate cut expectations rise) | USD/JPY down, EUR/USD up |
| CPI matches forecast | Modest reaction or fade of the initial move | Often range-bound or technical set-up dominates |
The above table clearly shows that:
- Core CPI usually has a stronger influence on the USD than headline CPI.
- PPI may shift currency direction ahead of CPI if it surprises significantly
- News traders often look for volatility breakouts in USD pairs during CPI releases.
Stocks: Inflation = Valuation Pressure
In equity markets, inflation means higher interest rates, which usually translate into lower stock prices, especially for growth stocks and tech-heavy indices like the NASDAQ.
| CPI/PPI | Stock Market Impact | Sectors Affected Most |
| Inflation is hotter than expected | Stocks fall(tightening fears) | Tech(NASDAQ), Consumer descretionary |
| Inflation is lower than expected | Short-term dip as producers face margin pressure | Industrials, Manufacturing |
| PPI surprises to the upside | Modest reaction or fade of initial move | Often, range-bound or technical set-up dominates |
- Markets may initially drop on hot CPI, but reverse if deeper components (like energy or shelter) show easing.
- PPI surprises often hurt B2B sectors that rely on input costs (e.g., logistics, wholesale)
For example,
“In February 2025, Core CPI came in at 3.1% YoY, slightly below the 3.2% forecast (Business Insider). Following the release, the Nasdaq Composite rallied 1.2%, driven by tech and consumer discretionary stocks (Investors.com).”
Commodities: Inflation Hedges & Rate Sensitivity
Commodities, especially gold and oil, react to CPI/PPI, but not always in the same direction. Their behaviour depends on how inflation affects currency value and rate expectations.
| CPI/PPI Outcome | Gold reaction | Oil reaction |
| CPI > ofrecast | Gold dips(rate hike pressure, USD strength) | Oil may rise(inflation = higher demand expressions) |
| CPI < ofrecast | Gold rallies(rate cut hopes, USD weakens) | Oil often follows broader macro sentiments |
| PPI surprises to the upside | Modest reaction or fade of initial move | Oil can spike short-term, then |
- Gold often moves inversely with real yields and the USD.
- PPI surprises can impact industrial metals and energy prices before consumer trends are clear
Combined Market Scenario: CPI + PPI + NFP
Inflation doesn’t exist in a vacuum. Traders often cross-reference CPI and PPI with other key indicators, such as NFP (Non-Farm Payrolls), to confirm directional bias.
| Scenario | Micro interpretation | Trading Implication |
| CPI rising + PPI rising + NFP strong | Inflation + growth = hawkish Fed | Buy USD, short stocks, avoid gold |
| CPI falling + PPI falling + NFP soft | Disinflation + weak labour = dovish Fed | Long stocks, long gold, short USD |
What are the Key takeaways?
Each asset class speaks its own language when it comes to CPI and PPI. However, when you learn to listen, you’ll be able to understand that:
- Forex tells you about expectations
- Stocks reveal sentiment
- Commodities show fear or faith in the Fed.
Understanding these signals empowers you to build a set of higher-probability setups, not just during the release but also in the days leading up to it. In the section that follows, we’ll zoom out and look at how CPI and NFP work together, and how experienced traders combine them to form high-conviction macro setups.
How to Trade CPI News Without Getting Burned
It’s one thing to understand how CPI and PPI influence markets, but it’s another to trade them safely and strategically.
Many traders make the same avoidable mistakes during high-impact news events, such as the release of the CPI. The result? Whipsaws, emotional decisions, and blown accounts.
This section will walk you through the most common pitfalls and how experienced traders manage risk around CPI releases.
1. Mistaking Initial Volatility for Direction
The first 1–5 minutes after a CPI release can be deceptive. Price often surges in one direction, only to reverse sharply as traders digest the actual numbers and context (like shelter inflation or revisions).
Here’s what you should do:
Consider waiting for the first few candles to close. Let the volatility “wash out” and observe whether volume supports continuation or reversal.
📉 A USD/JPY spike on hotter-than-expected CPI may reverse hard if wage growth was weak in the latest NFP report, or if the Fed was already signalling a pause.
2. Over-Leveraging During News Events
CPI releases can cause sudden 50–150 pip moves within seconds. Traders using excessive leverage may face margin calls, slippage, or even account wipeouts, especially if stop losses don’t trigger as expected.
What you should consider doing:
Reduce your position size during CPI and PPI windows. Many pros cut their lot size in half or use preset max-loss-per-trade rules.
Even a strong bias isn’t worth the risk of a large loss if execution risk is high. Treat CPI days as special risk days, not just normal setups.
3. Trading Without Context
Entering a CPI trade without knowing:
- The market’s recent inflation narrative
- What PPI showed earlier in the week
- How recent NFP data has shifted sentiment
…will amount to walking into a storm blindfolded.
Here’s what you should do:
Always frame CPI in context, what came before it (like PPI or NFP), what the US Fed is watching, and what the market has already priced in.
This is where combining macro data (like PPI trends, wage growth, and Fed commentary) provides a more stable view.
4. Ignoring Broker Conditions
Even if you have a rock-solid strategy, your execution environment matters. During CPI releases:
- Spreads may widen up to 5x
- Slippage increases
- Orders may not fill at the expected price.
Here’s what you should consider doing:
Check with your broker ahead of time. Some brokers freeze during news events; others allow pending orders but warn about slippage. If unsure, trade with demo data first to observe how your platform behaves under CPI pressure.
5. Forgetting to Log and Review
CPI days offer rich data for future setups, even if you don’t place a trade.
Here’s what you should consider doing:
Journal what you saw:
- What was forecast vs. actual?
- What did the first 15 minutes look like?
- Where did the price go after 1 hour?
- How did it correlate with the previous PPI or NFP?
Doing this consistently builds a pattern-recognition skill set that no trading indicators can match.
Now, let’s take a look at a real CPI event and break down exactly how it played out, so you can see all these ideas in action.
Case Study: How CPI Moved the Markets in June 2025
Nothing tests your trading preparation like real-world CPI volatility. In this case study, we’ll walk through the June 2025 U.S. CPI release, published on July 15, 2025, to analyse how markets reacted across currencies, stocks, and commodities.
This will help you understand how to trade CPI news with greater precision.
The Setup: Forecast vs. Actual (June 2025 CPI)
| Data Point | Forecast | Actual(June 2025) | Surprise? |
| Headline CPI YoY | 3.0% | 2.9% | Softer |
| Core CPI YoY | 3.1% | 3.1% | No Surprise |
| Core CPI MoM | 0.2% | 0.2% | No Surprise |
| PPI(Released earlier) | 0.5% | 0.5% | No Surprise |
Interpretation:
Headline CPI surprised slightly to the downside, fueling optimism that inflation was cooling, even though Core CPI held steady. Markets responded with modest risk-on moves as rate hike expectations softened.
Forex Reaction (USD/JPY & EUR/USD)
- USD/JPY initially dropped 40 pips, from 139.60 to 139.20, within minutes of the release.
- EUR/USD edged higher, climbing from 1.0830 to 1.0875 as the dollar weakened briefly.
However, both pairs returned to pre-release ranges within two hours, underscoring how a small inflation miss can create temporary volatility without sustained momentum.
Stock Market Reaction (NASDAQ)
Equity markets welcomed the softer headline:
- NASDAQ futures rose by 0.8% in early trading
- Gains were led by rate-sensitive sectors: Tech, Real Estate, and Consumer Discretionary.
This intraday rally aligned with hopes that the Fed may take a more patient stance going into the second half of the year.
Commodities: Gold Reacts to Dollar Weakness
- Gold (XAU/USD) climbed $14 intraday, boosted by the brief dollar pullback and lower real yields.
However, as the day progressed, gains faded and gold settled flat, highlighting uncertainty in market conviction despite softer inflation.
Markets responded modestly but meaningfully. According to a Reuters report, headline CPI came in at 2.9% YoY (vs. 3.0% forecast), prompting a mild rally in U.S. stocks and short-lived weakness in the dollar. Additional reports from Investing.com and Reuters also tracked the intraday behaviour of EUR/USD and NASDAQ following the print.
| Market | Initial Move | Later Reversal | Takeaway |
| USD/JPY | Dropped ~ 40pips | Recovered partially | Soft headline CPI briefly USD/JPY(Reuters) |
| EUR/USD | Dropped ~ 40pips | Settled back to~ 1.0850 | Dollar weakness faded after early CPI reaction(investing.com) |
| NASDAQ | Futures rose ~0.8% intraday | Closed near session high | Equities gained on softer headline CPI(Reuters) |
| Gold | Gained ~0.1% intraday | Flat by close | Brief gold rally faded, yields steadied(Reuters) |
What About the Next CPI Report?
The U.S. CPI report (released 2nd week of every month) at 8:30 AM ET
You can monitor the calendar via Forex Factory, investing.com, or bls.gov.
This upcoming release will likely reflect updated data from energy prices, shelter costs, and summer consumer trends, all key drivers in market volatility.
It’s time to talk about the tools and platforms traders rely on to prep, execute, and journal their CPI trades.
Best Tools and Platforms for Trading CPI News and Economic Data
In high-impact environments like CPI or PPI releases, having the right tools can make the difference between being prepared and being blindsided.
Below are some of the most reliable platforms and trading tools used by CPI-focused traders, including calendars, volatility overlays, and sentiment dashboards.
Economic Calendars
| Platform | Why Traders Use It |
| Forex Factory | Clean calendar, time-zone synced, impact ratings, forecast/actual comparison |
| Investing.com | Investing.com Real-time CPI data updates, charts, and historical trends |
| Trading Economics | Global inflation and macro events |
Use these tools to:
- Set alerts for CPI and PPI releases
- Track forecast vs actual results
- Monitor market sentiment around inflation trends.
Charting Platforms
| Platform | Strenght |
| TradingView | Customisable charts, CPI overlays, real-time volume + news fed |
| Meta Trader 4 | Ideal for + technical-level pre-CPI |
TradingView also allows you to visualise CPI data alongside asset price movements, helping you study how markets have historically reacted.
Volatility and Sentiment Tools
- ATR (Average True Range): Helps estimate how far the price may move post-CPI
- Bollinger Bands: Identify overextension during news spikes
- COT Reports (Commitment of Traders): Available on CFTC.gov, useful for larger macro traders
- News Squawk Services: Like RANsquawk or FinancialJuice, to hear CPI numbers live without delay
How to Trade CPI News Long-Term: Build a Repeatable System
Reacting to CPI releases one-off isn’t a strategy. If you want consistency, you need a repeatable framework that helps you improve with each release.
Here’s how experienced traders systematise their CPI playbook.
1. Track Key Metrics Over Time
Create a spreadsheet or dashboard to log:
- Forecasted vs actual CPI (YoY & MoM)
- Prior PPI outcomes
- Immediate market reaction (USD pairs, NASDAQ, gold)
- What worked / what didn’t
The above steps help build your personal CPI edge, based on real-world outcomes.
2. Backtest Trade Set Ups
Use past CPI dates to:
- Backtest straddle, post-spike, and continuation strategies
- Note which pairs responded cleanly.
- Identify recurring chart patterns (e.g., double spikes, flags)
Over time, you’ll notice what theory doesn’t teach you — how sentiment, positioning, and timing matter more than just the number.
3. Build CPI Trading Calendar
Build a visual map:
- CPI, Core CPI, and PPI release dates
- Recent NFP, GDP, and interest rate decisions
- Known Fed speeches around CPI time
This helps you frame CPI within broader macroeconomic events, enabling better pre-positioning.
4. Refine, Don’t React
Your goal isn’t to catch every CPI move; it’s to build a framework that improves with each cycle.
Over time, you’ll become better at:
- Knowing when not to trade
- Recognising fakeouts early
- Holding trades post-release based on deeper macro alignment
Consistency beats adrenaline. Especially when trading data-driven events like CPI.
Final Thoughts: Winning the Game of CPI Trading
So, which inflation report really moves the market?
The answer is still: Core CPI.
But when you combine it with:
- The leading signals of PPI
- The labour strength of NFP
- The macro backdrop from central banks
…you start seeing CPI not just as a number, but as a trade signal of deeper economic momentum.
To win with CPI trading, don’t just chase price, build a process:
- Prepare using the right tools
- Time entries with structured strategies
- Manage risk like a pro.
- Study real market behaviour, not just textbook theory.
Whether you’re trading USD/JPY, NASDAQ, or gold, this guide has given you the foundation to navigate CPI volatility with clarity.
FAQs: How to Trade CPI News [Expert Edition]
What is the CPI report, and why does it matter to traders?
The Consumer Price Index (CPI) measures inflation by tracking the price changes of goods and services purchased by households. It’s important because central banks use CPI to decide on interest rate changes, which can cause major volatility in forex, stocks, and commodities.
How do I prepare for trading CPI?
Traders often use economic calendars to monitor CPI release times and compare forecasted vs previous values. Some may analyse related indicators, such as PPI or market technical levels, to anticipate potential volatility. It’s also common to review risk exposure ahead of major economic releases.
Is CPI more important than PPI?
Yes. In the short term, CPI (especially Core CPI) tends to trigger stronger, faster price moves. But PPI remains a useful leading indicator of future CPI trends.
How does CPI affect USD/JPY?
Hotter-than-expected CPI often correlates with upward moves in USD/JPY, driven by expectations of interest rate hikes. However, price movements may vary depending on broader sentiment and other economic data.
Which markets tend to react strongly to CPI data?
CPI releases can influence several instruments, including:
- Forex: USD/JPY, EUR/USD, GBP/USD
- Indices: NASDAQ, S&P 500
- Commodities: Gold (XAU/USD), Oil (WTI/Brent)
Each may react differently depending on the inflation outcome versus forecasts.
RISK WARNING: CFDs are complex financial instruments and carry a high risk of losing money rapidly due to leverage. You should ensure you fully understand the risks involved and carefully consider whether you can afford to take the high risk of losing your money before trading.
Disclaimer: The information is provided for educational purposes only and doesn’t take into account your objectives, financial circumstances, or needs. It does not constitute investment advice. We encourage you to seek independent advice if necessary.
The information has not been prepared in accordance with legal requirements designed to promote the independence of investment research. No representation or warranty is given as to the accuracy or completeness of any information contained within.
This material may contain historical or past performance figures and should not be relied on. Furthermore, estimates, forward-looking statements, and forecasts cannot be guaranteed. The information on this site and the products and services offered are not intended for distribution to any person in any country or jurisdiction where such distribution or use would be contrary to local law or regulation.
References
1. “South Africa inflation steady in May”— Headline inflation held at 2.8% YoY, core at 3.0%, both within SARB’s 3–6% target range Reuters.com
2. “South Africa Producer Price Index Growth” — PPI rose to 1.1% in January 2025 from 0.7% in December, indicating rising producer costs, ceicdata.com
3. “PPI vs Forex reaction guide” — Analysis noting that strong or weak PPI readings typically produce muted ZAR movement unless CPI confirms trends, investing.com