
 Updated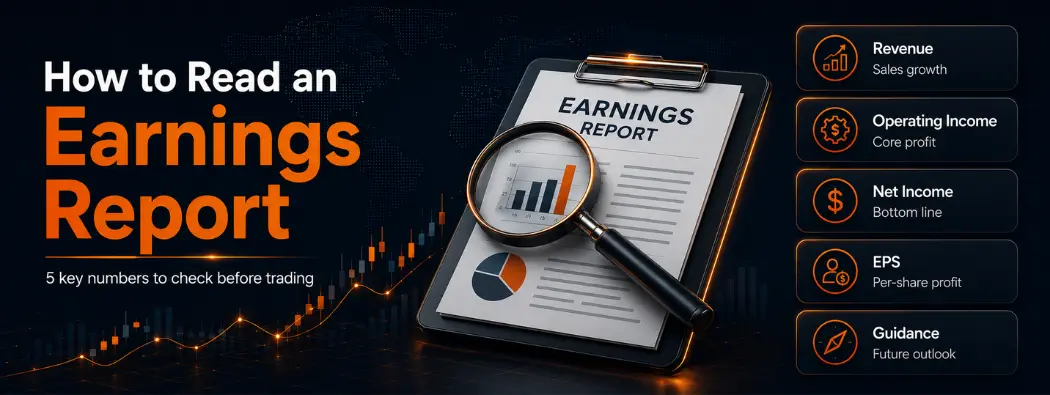
Many traders see a headline that says a company “beat earnings” or “missed expectations” and immediately focus on the stock price reaction.
The better approach is to understand what the report actually says before paying attention to the headlines.
Learning how to read an earnings report can help you interpret a company’s financial performance, understand what management is saying about the future, and see why a stock may react the way it does.
This guide is designed for South African traders who follow US shares through CFDs. It focuses on the reading skill itself: the numbers, what they mean, how to judge their quality, and how the market tends to respond.
To read a company’s earnings report, focus on five key areas: revenue, operating income, net income, earnings per share (EPS), and guidance. Then compare those figures with expectations, assess the quality of the earnings, and remember that stock reactions are often driven by future outlook rather than headline results alone.
Before risking real money, consider practising with earnings-related market moves in a demo account.
Risk Warning: CFDs are complex financial instruments and carry a high risk of rapid loss of money due to leverage.
What’s in a Company Earnings Report?
A company’s earnings report contains the financial results and business update that management provides to investors and the market.
Most traders start with the earnings press release because it summarises the key numbers and highlights the main developments from the reporting period.
A typical earnings report includes several parts:
- The income statement
- The balance sheet
- The cash-flow statement
- Management commentary in the earnings release
- The earnings call and question-and-answer session
The income statement is usually the first section traders read. It shows how much revenue the company generated, what it spent to generate that revenue, and how much profit remained after expenses.
The balance sheet provides a snapshot of the company’s assets, liabilities, and financial position at a specific point in time.
The cash-flow statement shows how cash moved through the business during the reporting period. It can help traders understand whether reported profits are supported by actual cash generation.
Most listed companies publish quarterly earnings reports and annual reports. Quarterly reports tend to attract the most market attention because they provide regular updates on performance and future expectations.
The key point is that an earnings report is more than a single profit number. It combines financial results, management commentary, and future guidance into one package that traders must interpret carefully.

How to Read an Earnings Report – The Lines You Need To pay Attention To
The most important skill is knowing which numbers deserve your attention and what they actually tell you about the business.
Many earnings reports contain dozens of figures. Most traders start by focusing on a handful of key line items that help explain growth, profitability, and business performance.
| Line Item | What It Tells You |
| Revenue | How much money the company generated from its operations |
| Operating Income | Profit from the core business before interest and taxes |
| Net Income | The company’s final profit after all expenses |
| EPS | Profit allocated to each share outstanding |
| Margins | How efficiently the company converts sales into profit |
Revenue, often called the top line, is usually the first number traders examine. Rising revenue can indicate growing demand, while slowing revenue growth may suggest a business is losing momentum.
Next comes operating income, which measures profit from the company’s core activities. This figure helps separate the underlying business from financing or one-off items.
Net Income
Net income, sometimes called the bottom line, shows what remains after all costs, taxes, and expenses have been deducted. A company can grow revenue and still disappoint investors if profits fail to keep pace.
Earnings per share (EPS) is one of the most closely watched figures during earnings season. Rather than focusing only on total profit, EPS shows how much profit is attributed to each share. Understanding what EPS means can help traders compare results across reporting periods.
Margins help explain the relationship between sales and profit. Expanding margins can suggest improving efficiency, while shrinking margins may indicate rising costs or pricing pressure.
These figures work together.
A company may report strong revenue growth, but if margins fall sharply, profitability may not improve. Another company may grow revenue slowly but expand margins and deliver stronger earnings growth.
The goal is not to focus on a single number. It is to understand how revenue, profits, EPS, and margins connect to tell the broader story of the business.
Guidance and the Earnings Call — Where the Stock Often Moves
The earnings report explains what happened. Guidance and the earnings call explain what management believes may happen next.
That is one reason why guidance can sometimes matter more than the headline earnings figures.
A company may report strong revenue and profit growth, yet investors can still react negatively if management lowers its outlook for the next quarter or year. The opposite can also happen when current results are mixed, but future expectations improve.
Guidance typically covers areas such as:
- Expected revenue growth
- Profitability targets
- Market conditions
- Product launches or business initiatives
- Potential risks and opportunities
The earnings call adds another layer of information.
During the call, company executives discuss the results in greater detail and answer questions from analysts. Traders often pay close attention to management’s tone, confidence level, and comments about future performance.
For example, a company may technically beat earnings expectations, but management could sound cautious about demand, costs, or future growth. Markets frequently react to these signals because they provide context that the financial statements alone cannot capture.
This does not mean traders should focus on management’s comments instead of the numbers. The most effective approach is to read both together.
Strong results supported by confident guidance often tell a different story than strong results followed by a cautious outlook. Understanding that difference is key to properly reading an earnings report.
Putting the Numbers in Context – Beat, Miss, and the P/E
An earnings number means very little on its own. What matters is how that number compares with expectations and how the market values the company.
When analysts follow a company, they publish estimates for revenue, earnings, and other financial metrics. These estimates form the market consensus.
A company is said to have beaten expectations when its reported results exceed the consensus forecast. A miss occurs when the reported figures fall short.
This is why two companies with identical earnings growth can receive very different market reactions. One may exceed expectations and be rewarded, while the other may disappoint because investors expected even stronger results.
Valuation also matters.
A company trading at 20 times earnings, often written as 20x earnings, is valued at twenty times its annual profit. This is commonly measured using the price-to-earnings (P/E) ratio.
Higher P/E ratios often suggest investors expect stronger future growth. Lower P/E ratios may indicate lower growth expectations or greater uncertainty.
The key point is that strong earnings do not automatically make a stock attractive, and weak earnings do not automatically make it unattractive. Results must be viewed alongside expectations and valuation.
To understand these concepts in greater depth, see the guides on how a beat or miss is judged and what the P/E ratio tells you. This article focuses on how to read the report itself rather than how analysts value a company.
Quality of Earnings — Are the Numbers Real?
Strong earnings do not always mean strong underlying business performance.
One of the most valuable skills a trader can develop is the ability to assess the quality of earnings, not just the size of reported profits.
Start by looking for one-off or non-recurring items. A company may report a large profit because it sold an asset, received a legal settlement, or benefited from an unusual accounting adjustment. These events can boost earnings temporarily without improving the core business.
Next, compare GAAP and adjusted (non-GAAP) figures.
GAAP earnings follow standard accounting rules. Adjusted earnings remove certain expenses or gains that management considers non-recurring. These adjustments can provide useful context, but traders should always examine what has been excluded and why.
Revenue quality also matters.
If revenue growth is accelerating, ask whether it comes from genuine business activity or from accounting changes, acquisitions, or unusually favourable conditions that may not persist.
The cash-flow statement provides another important check. A company reporting rising profits should ideally generate healthy operating cash flow as well. If profits are growing but cash generation remains weak, traders may want to investigate further.
Quality of Earnings Checklist
Before forming a view, ask:
- Were profits boosted by one-off events?
- Do adjusted earnings differ significantly from GAAP earnings?
- Is revenue growth sustainable?
- Does operating cash flow support reported profits?
- Has management clearly explained major adjustments?
The goal is not to find perfect companies. It is to understand whether reported earnings reflect genuine business performance or temporary factors.
A Worked Example – Reading a Quarterly Report Line by Line
The easiest way to learn how to read an earnings report is to walk through a simplified example.
The figures below are purely illustrative and do not represent any real company or current financial results.
Hypothetical Quarterly Results
| Metric | Result | Prior Year |
| Revenue | $1.2 billion | $1.0 billion |
| Operating Margin | 18% | 15% |
| EPS | $1.10 | $0.90 |
| Analyst EPS Expectation | $1.05 | — |
| Full-Year Guidance | Increased | — |
This example is illustrative only and does not represent actual market performance or future outcomes.
At first glance, the report looks strong.
Revenue increased from $1.0 billion to $1.2 billion, suggesting that demand for the company’s products or services improved during the quarter.
Operating margin expanded from 15% to 18%. This indicates that the company converted a greater share of its revenue into operating profit, which may suggest greater efficiency or pricing power.
EPS rose from $0.90 to $1.10 and exceeded analyst expectations of $1.05. This would be classified as an earnings beat.
Management also raised its full-year guidance, which suggests confidence in future performance.
Now look deeper.
Buried in the notes is a disclosure that part of the increase in profit came from the sale of a business asset. The company also reported operating cash flow growth that was much weaker than earnings growth.
These details do not automatically make the results poor. They do, however, create a quality-of-earnings question that deserves further investigation.
The lesson is simple: read beyond the headline numbers. Strong revenue growth, improving margins, higher EPS, and positive guidance are important, but understanding how those results were achieved is equally important.
How Does the Stock React to Earnings?
Stock prices do not react to earnings results alone. They react to how those results compare with expectations.
This is one reason why earnings season can be confusing for newer traders.
A company may report higher revenue, stronger profits, and an earnings beat, yet the stock still falls. In many cases, investors were expecting even better results or were disappointed by the company’s future guidance.
The opposite can happen as well.
A company may miss earnings expectations but still see its stock rise if management provides a stronger outlook, announces positive developments, or reassures investors about future growth.
This is why market reactions are often described as a comparison between expectations and reality.
Earnings announcements can lead to significant price volatility and rapid market movements. For CFD traders using leverage, both gains and losses may be amplified.
Several factors can influence the reaction:
- Revenue and earnings versus analyst forecasts
- Forward guidance
- Management commentary during the earnings call
- Valuation levels
- Broader market sentiment
Many traders also ask whether stocks usually go up or down before an earnings report.
The honest answer is that there is no reliable rule. Some stocks rally before earnings, others fall, and many move unpredictably. Markets constantly adjust expectations as new information becomes available.
The key takeaway is that earnings reports help explain why a stock moved, but they do not provide a simple formula for predicting future price action. Reading the report carefully is more useful than trying to guess the market’s next move.
Where to Find Reports and How to Read Them as a CFD Trader
Company earnings reports are widely available if you know where to look.
The most reliable source is the company’s investor relations website, where earnings releases, presentations, transcripts, and regulatory filings are usually published shortly after results are announced.
Traders can also use earnings calendars, financial news platforms, and market-data services to find upcoming reports and reporting dates.
If you want to follow reporting schedules more closely, see the guide on trading around earnings season and the earnings calendar resources linked there.
For a share-CFD trader, the goal is slightly different from that of a long-term investor.
A CFD trader does not own the underlying stock. Instead, they use earnings reports to understand the company’s performance, evaluate market expectations, and form a view on potential price direction, whether bullish or bearish.
The reading process remains the same.
Revenue, earnings, margins, guidance, and quality of earnings still matter. The difference is that a CFD trader is analysing the information to understand price behaviour rather than to assess ownership in the business.
Before trading around major earnings announcements, consider practising in a demo account. It can help you become familiar with how markets react to new information without risking real capital.
Conclusion
Reading an earnings report is about more than checking whether a company made a profit.
The most useful approach is to focus on the key line items, understand how they connect, assess the quality of the earnings, and compare the results with market expectations.
Revenue, operating income, net income, EPS, margins, guidance, and cash flow each provide part of the story. Looking at them together gives a clearer picture of how the business is performing.
It is equally important to remember that stock reactions are driven by expectations, not just by the reported numbers. A strong report can disappoint the market, and a weaker report can be received positively if expectations were lower.
If you are new to earnings analysis, consider practising with a demo account first. Once you are comfortable reading reports and interpreting reactions, you can apply those skills in your own market analysis.
Frequently Asked Questions
How do you read an earnings report?
Start with revenue, operating income, net income, EPS, and margins. Then review guidance, compare results with expectations, and assess the quality of the earnings before interpreting the market reaction.
What do earnings reports mean for stocks?
Earnings reports provide information about a company’s performance and outlook. Stock reactions depend on how the results compare with market expectations, not just the headline numbers.
What does 20x earnings mean?
A stock trading at 20x earnings is valued at twenty times its annual earnings. This is commonly measured using the price-to-earnings (P/E) ratio.
What is quality of earnings?
Quality of earnings refers to the sustainability and reliability of reported profits. Traders often examine one-off items, cash flow, and accounting adjustments to assess earnings quality.
Do stocks usually go up or down before an earnings report?
There is no consistent pattern. Some stocks rise, some fall, and many move unpredictably as investors adjust their expectations ahead of the announcement.
Where can I find company earnings reports?
The best source is the company’s investor-relations website. Earnings releases, presentations, transcripts, and regulatory filings are usually published there.
What is the difference between GAAP and adjusted earnings?
GAAP earnings follow standard accounting rules. Adjusted earnings exclude certain items that management considers non-recurring or not representative of normal operations.
How do I trade around earnings reports?
This article focuses on reading earnings reports. For earnings-season trading approaches, see the dedicated guide.
Why can a stock fall after beating earnings estimates?
A stock can decline after a beat if investors expected stronger results, if guidance disappoints, or if the valuation already reflects positive expectations.
Risk Warning: CFDs are complex financial instruments and carry a high risk of rapid loss of money due to leverage. You should ensure you fully understand the risks involved and carefully consider whether you can afford to take the high risk of losing your money before trading.
Disclaimer: The information is provided for educational purposes only and doesn’t take into account your personal objectives, financial circumstances, or needs. It does not constitute investment advice. We encourage you to seek independent advice if necessary. No representation or warranty is given as to the accuracy or completeness of any information contained within.
This material may contain historical or past performance figures and should not be relied on. Furthermore, estimates, forward-looking statements, and forecasts cannot be guaranteed. The information on this site and the products and services offered are not intended for distribution to any person in any country or jurisdiction where such distribution or use would be contrary to local law or regulation.
References
- https://www.vantagemarkets.com/en-za/terminology/earnings-reports-definition/ – Earnings reports.
- https://www.vantagemarkets.com/terminology/cash-flow-statement-definition/ – Cash flow statement.
- https://www.vantagemarkets.com/en-za/terminology/net-income-growth-definition/ – Net income growth.
- https://www.vantagemarkets.com/en-za/terminology/earnings-per-share-definition/ – Earnings per share.
- https://www.vantagemarkets.com/en-za/academy/what-is-p-e-ratio/ – What is a good P/E ratio?
- https://www.vantagemarkets.com/en-za/academy/trade-us-earnings-season/ – How to trade during US earnings season.