
Many traders start looking into candlestick reversal patterns after repeatedly encountering the same problem. Price looks ready to move one way, they enter, and then the market turns against them.
That kind of experience pushes traders to ask better questions. Why did the price reverse there? Was there a warning on the chart? Could that move have been spotted earlier?
Candlestick reversal patterns help answer those questions. A candlestick shows the open, high, low, and close of a price move. Some candle shapes can hint at buyer or seller strength.
In this guide, you will learn everything you need to know about
- candlestick reversal pattern
- How the candlestick reversal pattern differs from the continuation pattern
- The different candlestick patterns: bullish and bearish
- Best technical indicators to use along with it
- How you can use these patterns in trading
Candlestick patterns are widely used by many traders in technical analysis. Still, they do not provide reliable signals on their own and should not be relied upon as the basis for any trading.
Key Takeaways
- Candlestick reversal patterns are a foundational technical analysis tool for reading potential shifts in market sentiment between buyers and sellers.
- Bullish patterns, such as the Hammer and Morning Star, are studied after downtrends, while bearish patterns, such as the Shooting Star and Evening Star, are examined after uptrends.
- Where a pattern is located matters; formations found near key support or resistance levels are generally considered more significant.
- Single-candle patterns are generally considered to carry more weight when confirmed by the candle that follows than when read in isolation.
- Candlestick patterns have been found to be more effective when used alongside complementary tools such as RSI, moving averages, and volume analysis.
What Is a Candlestick Reversal Pattern?
A candlestick reversal pattern is a price formation that suggests the current trend may be losing strength and could change direction.
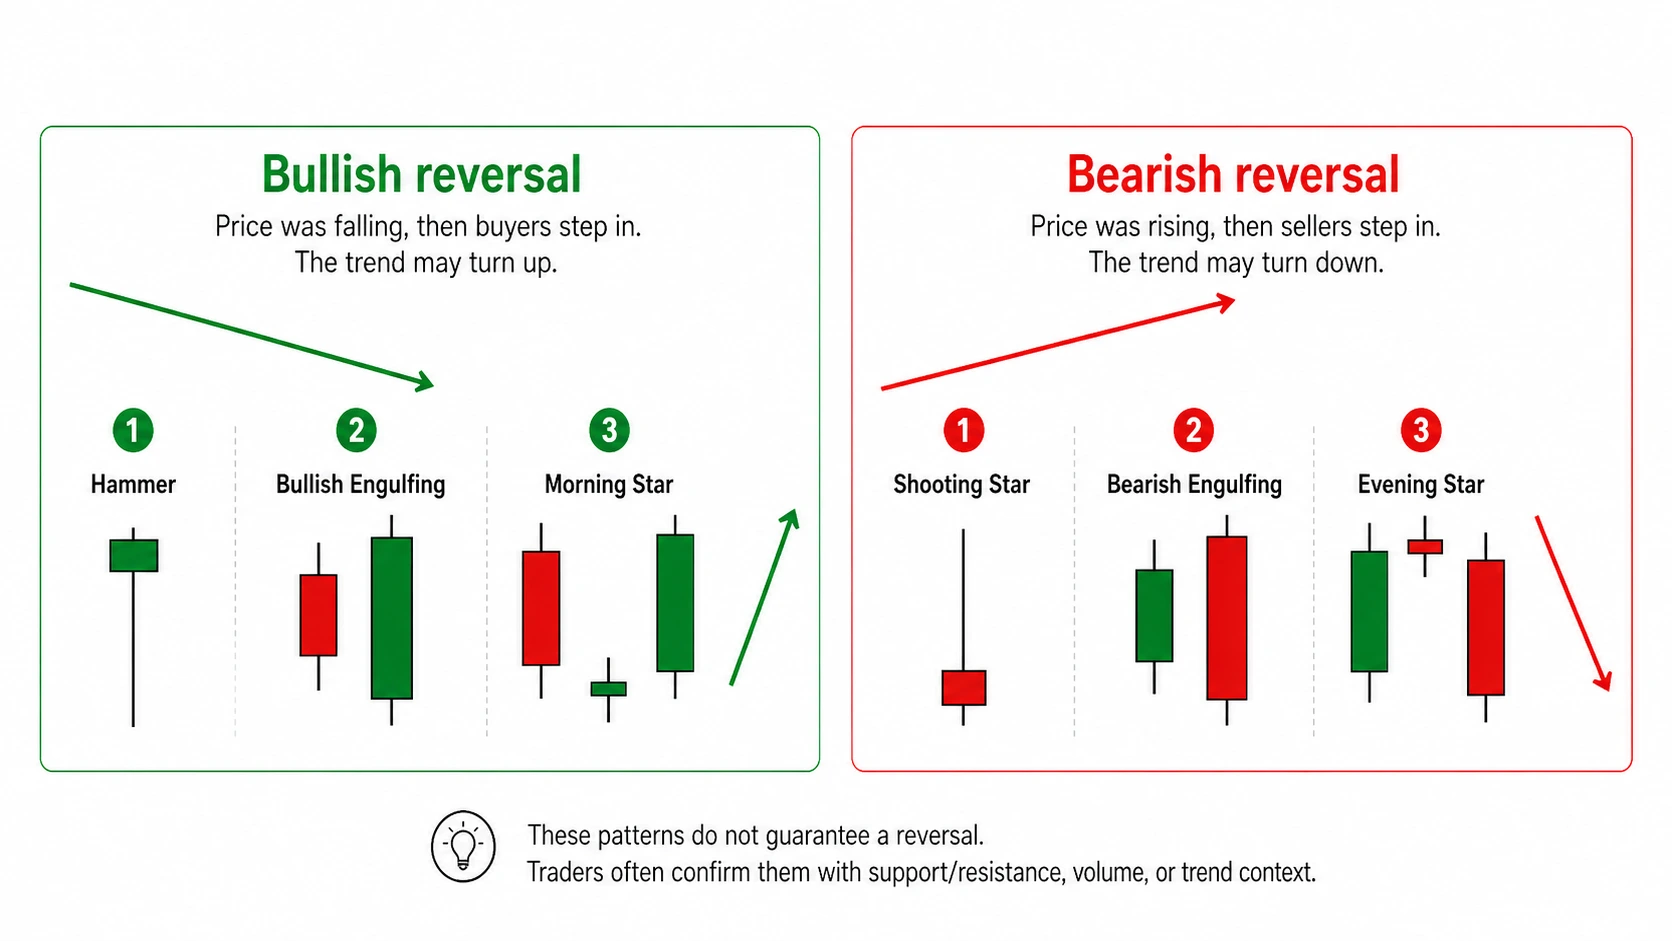
It comes in both bullish and bearish forms. A bullish reversal pattern appears after a downtrend and suggests the price may start rising.
A bearish reversal pattern forms after an uptrend and often suggests that the price may begin to decline. These patterns reflect a shift in control. In simple terms, they show that the side that had power may be starting to lose it. Buyers may begin to take control from sellers, or sellers may begin to take control from buyers.
Why These Patterns Matter to Traders
Reversal patterns are popular because they can help traders read possible turning points before a move becomes obvious. They are often used to:
They help with trade timing. A trader may use a bullish reversal pattern to look for a buy setup. A trader may use a bearish reversal pattern to look for a sell setup. Reversal patterns matter because they help traders read market mood. They show when momentum may be slowing down or changing direction.
They are also easy to see on a chart, which makes them attractive to beginners. But that ease can also create problems. Many traders memorise shapes without learning how to judge the quality of the setup. That is where mistakes begin.
They also support risk control. A trader can place a stop-loss around the pattern’s high or low. This gives the trade a clear structure.
These patterns are used in many markets. That includes forex, stocks, indices, commodities, and crypto.
NOTE: No pattern works every time. Markets can produce false signals. That is why context matters.
What a Reversal Pattern Is Really Telling You
At the core, every reversal pattern reflects a shift in market pressure.
A long lower wick can show that sellers pushed hard, but buyers stepped in and forced the price back up. A bearish engulfing candle can indicate that buyers lost control and sellers responded with greater force. A doji can suggest hesitation, balance, or loss of momentum.
Each pattern tells a short story about the fight between buyers and sellers. The trader’s job is to read that story in the right setting.
Common Bullish Reversal Patterns
1. Hammer Candlestick
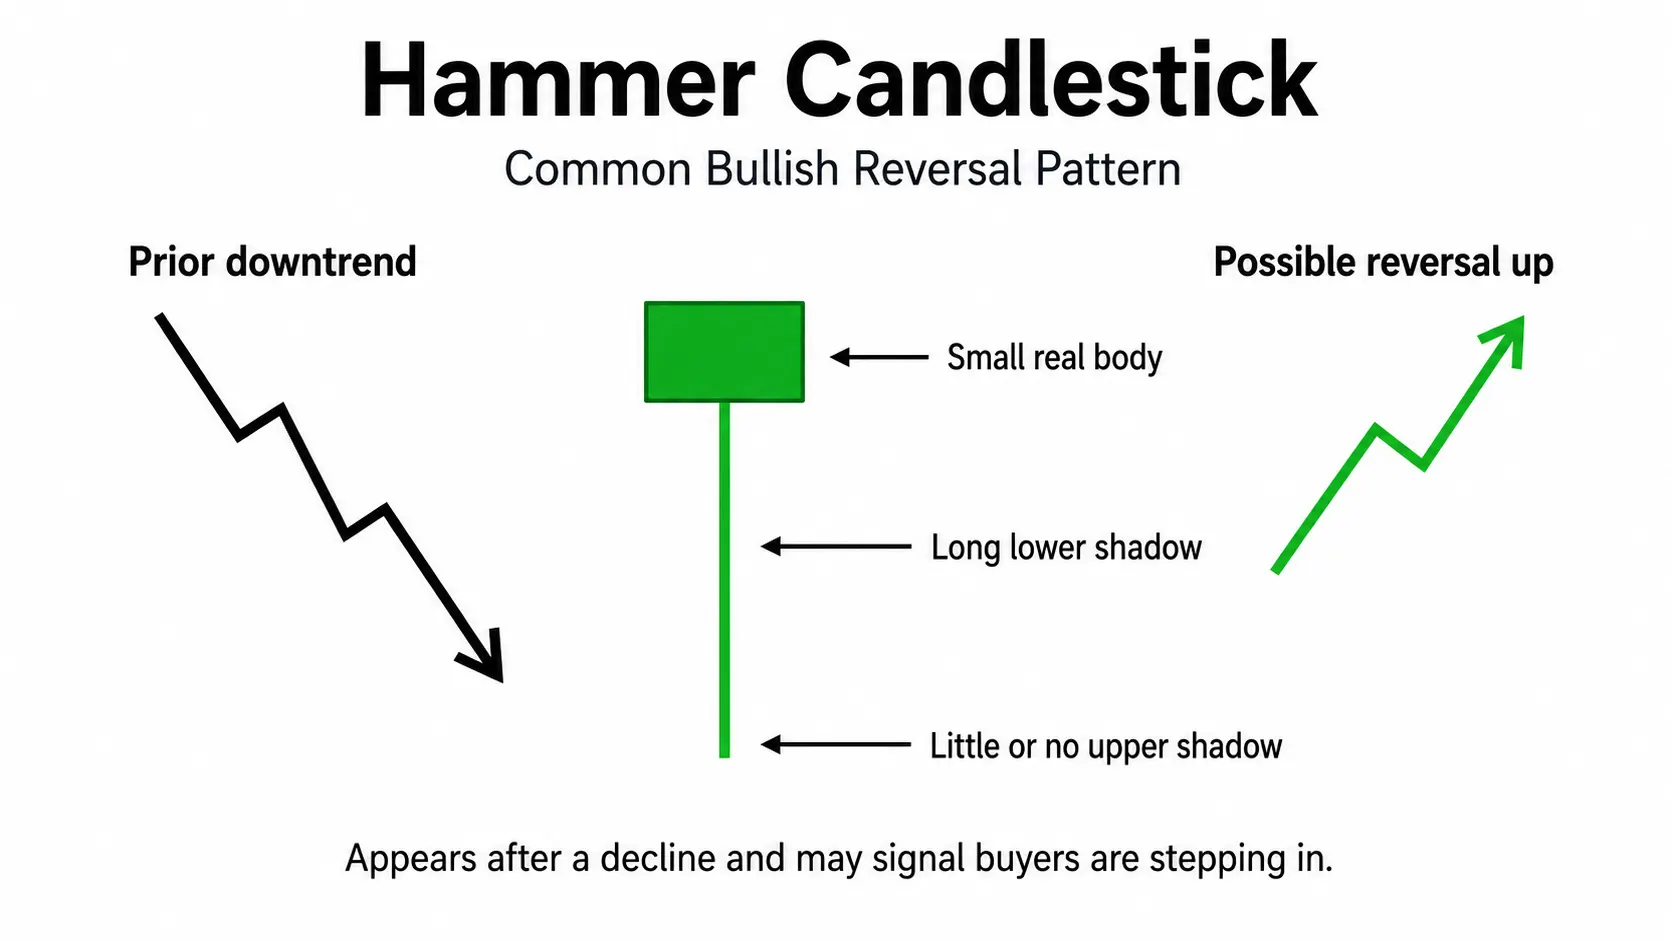
The hammer is one of the most recognized single bullish reversal candles. It usually forms after a decline and has:
- a small body near the top of the candle
- a long lower shadow
- little or no upper shadow
This shape shows that the market traded lower, but buyers managed to push the price back up before the candle closed. That does not confirm a full reversal on its own, but it can signal that selling strength is fading.
A hammer is more useful when it forms near a support zone or after a sharp drop.
2. Inverted Hammer
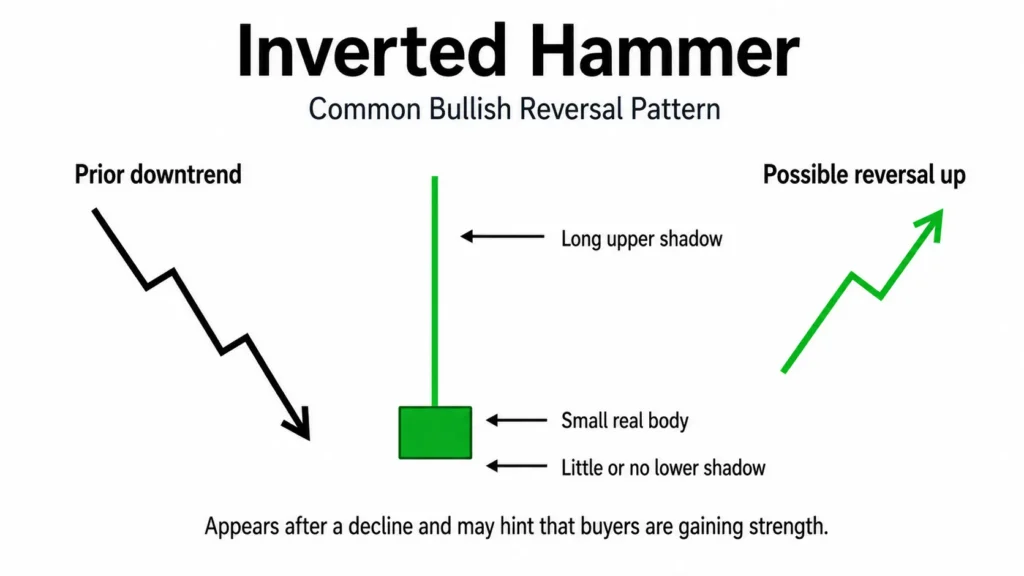
The inverted hammer candlestick pattern is a bullish reversal. It usually comes after a downward move.
This candle has a tiny real body near its lower end. It also has a large upper shadow. There is almost no lower shadow, or none at all.
This shape indicates that buyers were attempting to extract price from the session by pushing prices higher. Sellers retraced the price before the close, but the bullish movement still matters. It indicates that buying interest may be developing.
The inverted hammer on its own does not indicate a reversal. Typically, traders wait for the following candle to close above. That next move is part of what shows buyers are taking charge. This is more significant when it occurs just above or just below a support zone. It is not as reliable in a weak or sideways market.
3. Bullish Engulfing Candlestick
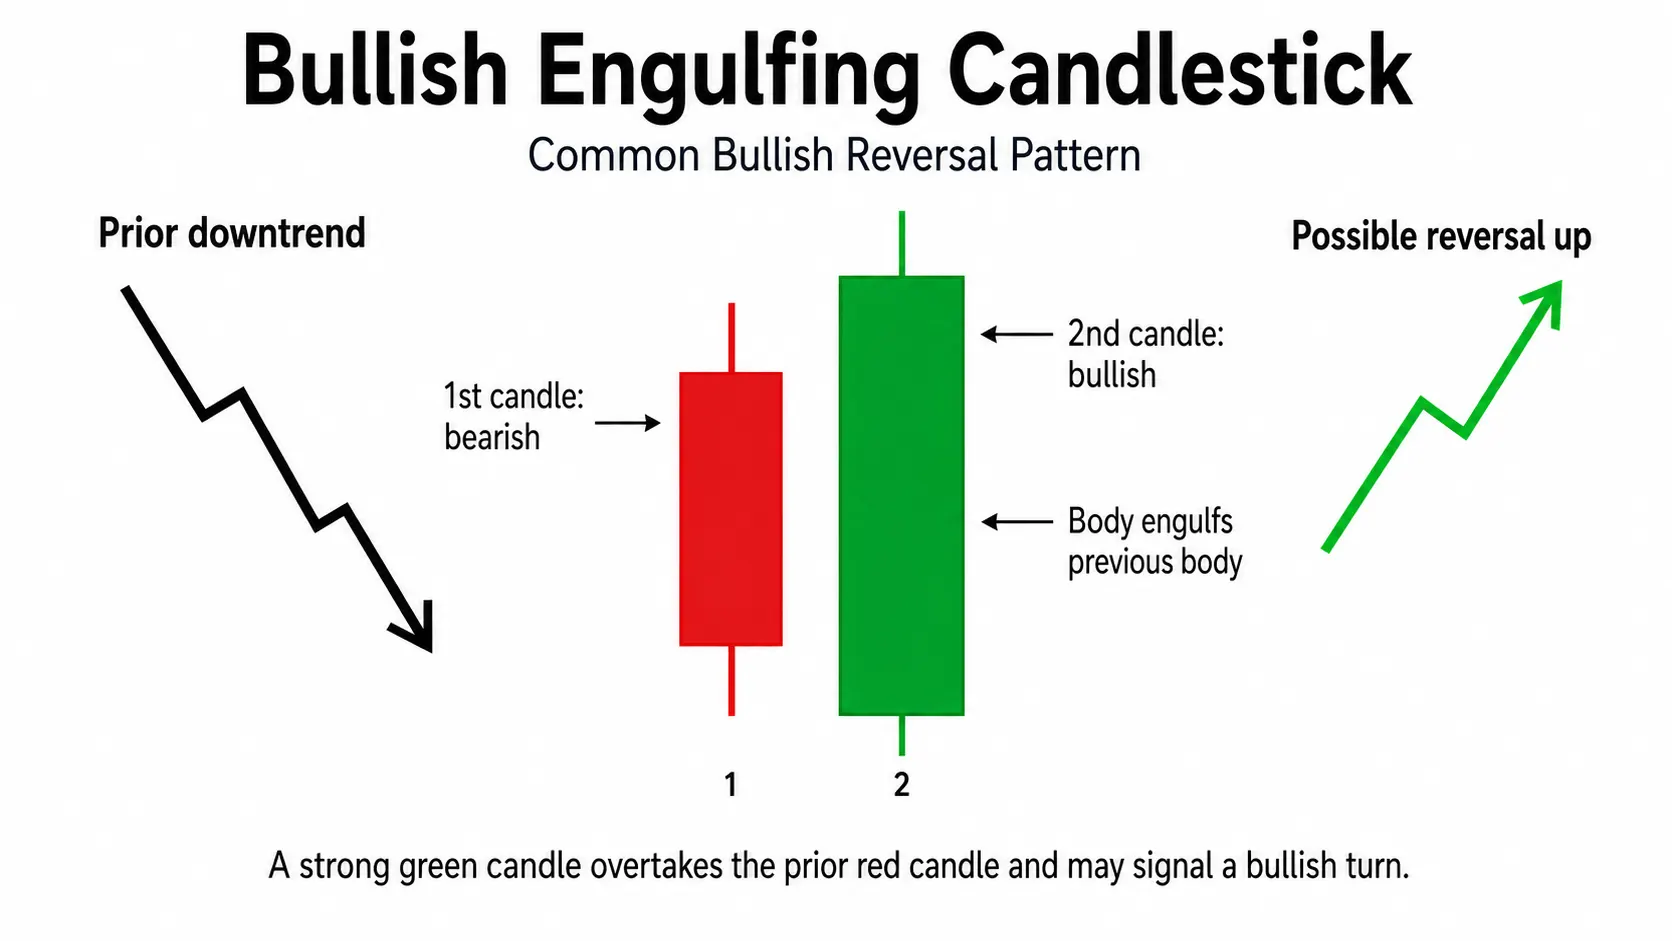
This is a two-candle pattern. The first candle is bearish. The second candle is bullish, and its body fully covers the body of the first candle.
That shift suggests buyers came in with enough force to erase the prior bearish move. It often signals a greater change in sentiment than a single-candle pattern.
4. Bullish Harami

The bullish harami is a two-candle formation. It means “pregnant” in Japanese, meaning it begins with a larger bearish candle (mother candle), followed by a smaller bullish candle (baby candle) whose body lies within the first candle’s body.
In source definitions, the pattern is described as a sign that downward momentum is weakening. It is therefore usually interpreted as a possible bullish reversal signal, though not as a complete confirmation on its own. It increases the likelihood that a second candle will form as a Doji, thereby creating an equal balance between buyers and sellers.
5. Morning Star
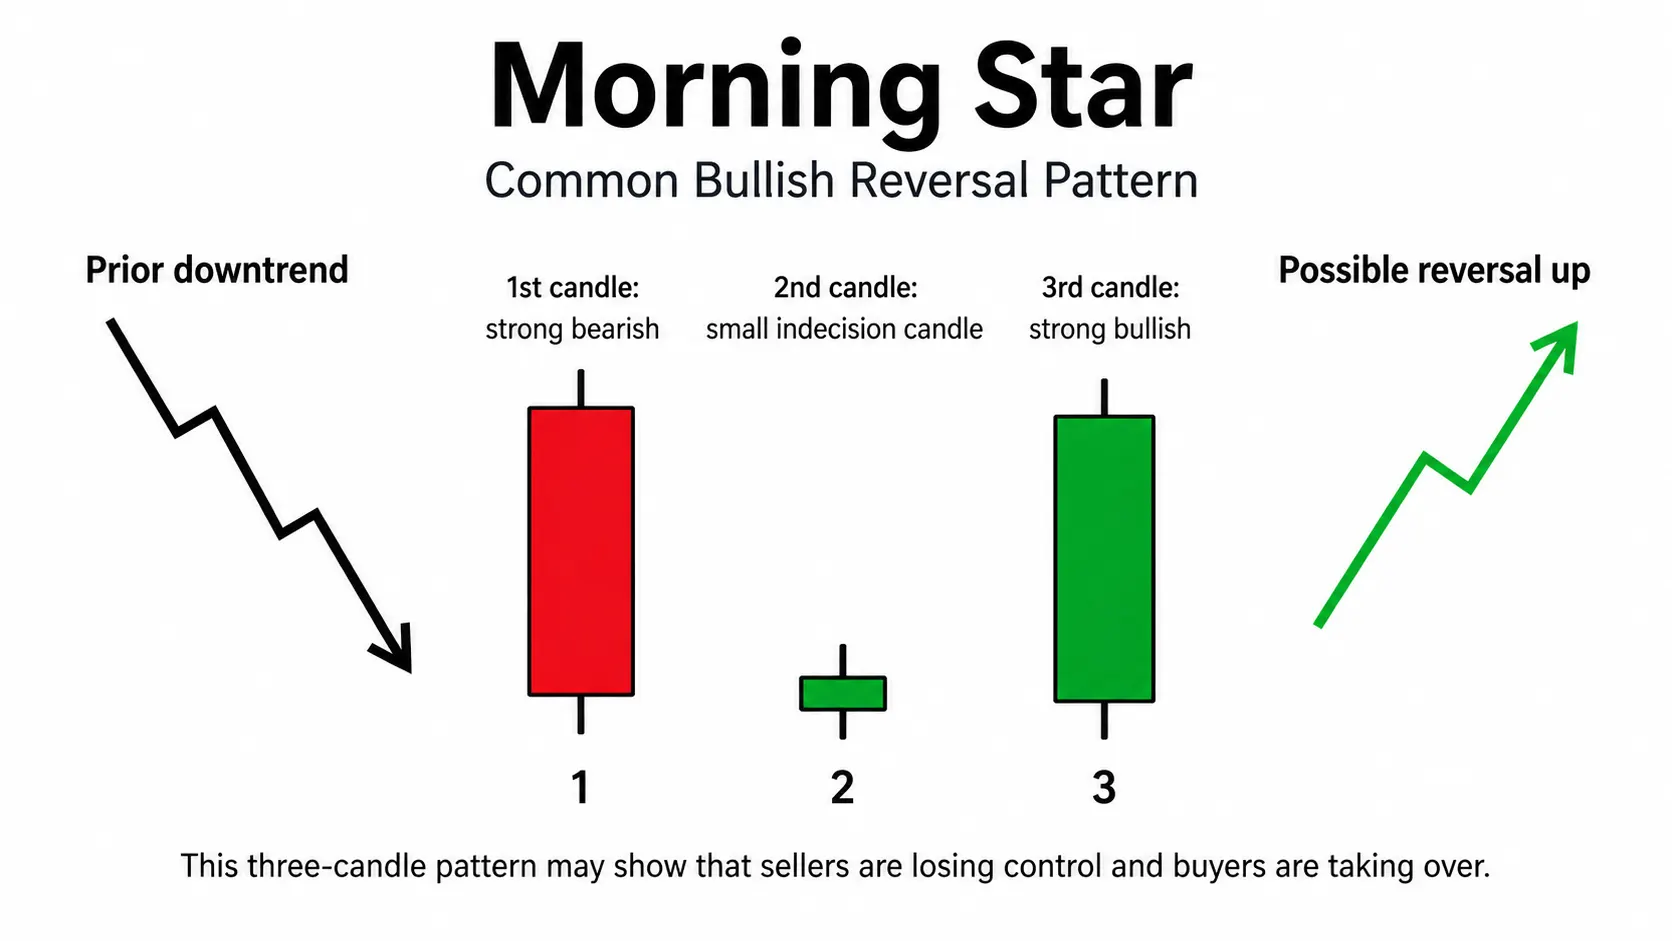
The morning star is a three-candle formation that often appears at the end of a downtrend. It usually includes:
- a strong bearish candle
- a small candle showing indecision
- a strong bullish candle
This pattern can suggest that the bearish move is weakening and buyers are beginning to take over.
6. Piercing Pattern

This is another two-candle bullish setup. The first candle is bearish. The second candle opens lower but closes above the midpoint of the first candle’s body.
That tells traders that sellers had control at the start, but buyers fought back strongly before the close. In a piercing candlestick pattern, the first candlestick is dominated by sellers, and the second shows enthusiastic buying. The first candlestick is usually colored red, which signifies a down day. The second candlestick is green or light-coloured, signifying a day that closes higher than it opened.
Common Bearish Reversal Patterns
1. Shooting Star
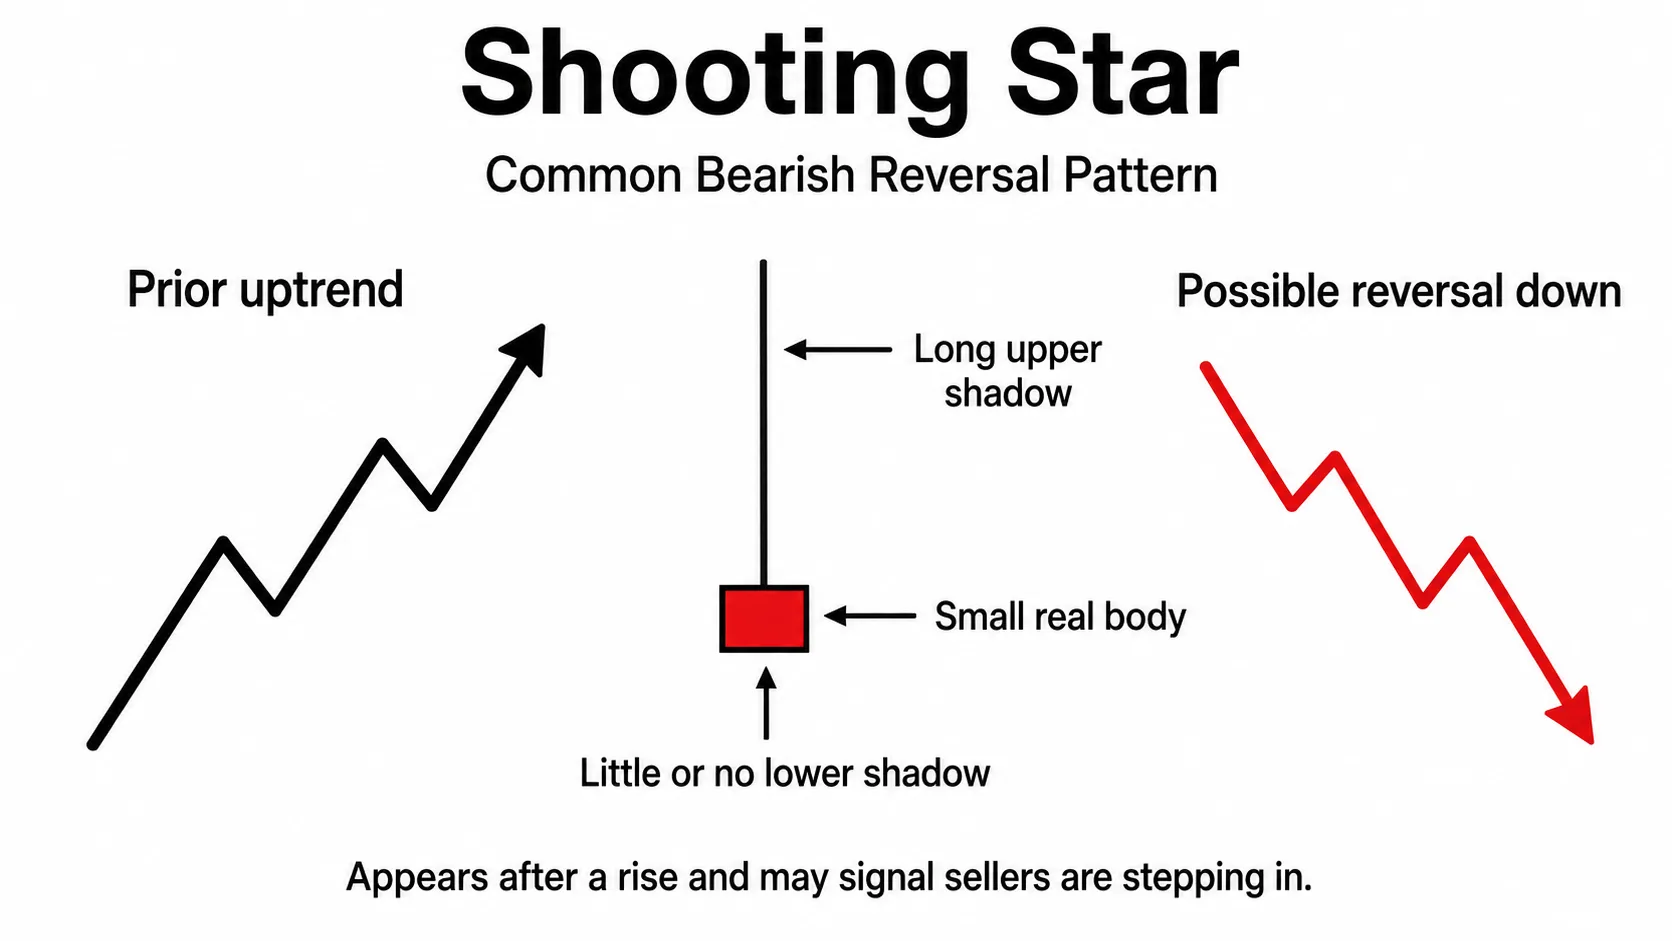
The shooting star is a bearish chart pattern that often appears after an upward move. It has:
- a short body sitting near the lower portion of the candle
- a long wick extending well above the body
- little to no wick beneath
This shows that buyers pushed the price higher, but sellers forced it back down before the candle closed. That can be a sign that the rally is losing strength. It tends to carry more weight near resistance.
2. Shooting Star Vs Inverted Hammer
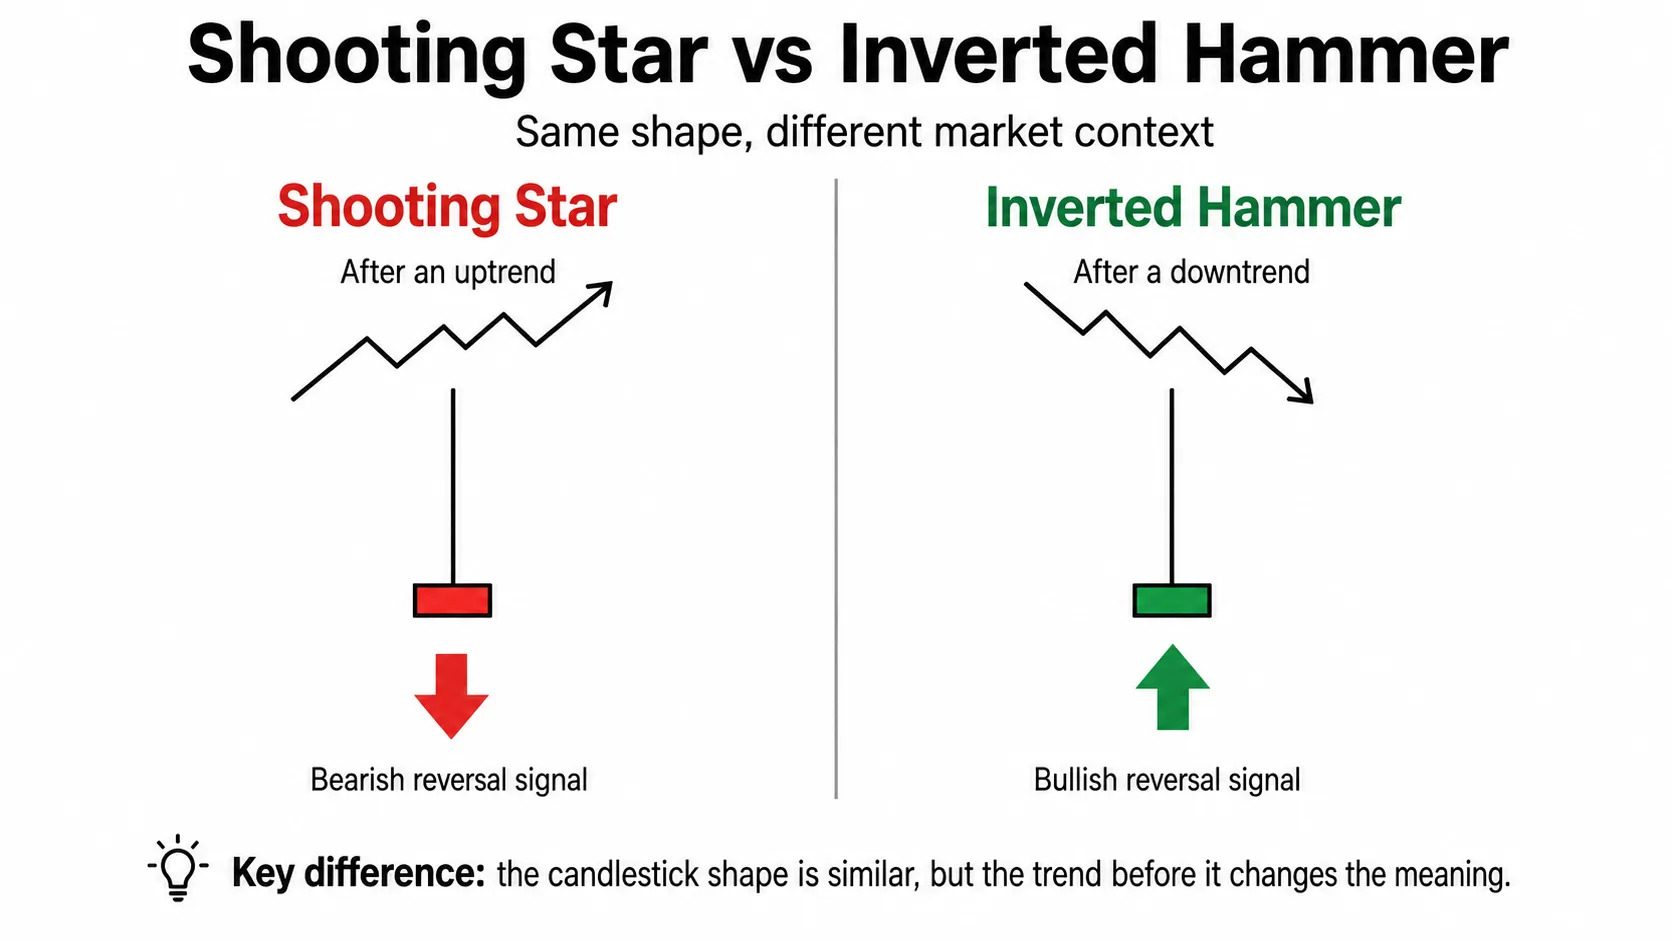
The Shooting Star and Inverted Hammer look very similar. The main difference is where they appear.
- A Shooting Star appears after the price has moved up.
- An Inverted Hammer appears after the price has moved down.
| Feature | Shooting Star | Inverted Hammer |
| Main signal | Suggests a bearish reversal | Suggests a bullish reversal |
| What it looks like | Small body near the low, long upper wick, little or no lower wick | Small body near the low, long upper wick, little or no lower wick |
| What makes it different | The trend before it forms | The trend before it forms |
| Market meaning | Buyers pushed the price higher, but sellers forced it back down | Buyers may often try to push the price higher after a fall, showing early strength |
| Trader message | Uptrend may be losing strength | The downtrend may be losing strength |
| Best confirmation | A bearish candle after the pattern | A bullish candle after the pattern |
| Ideal location | Near resistance or after a strong rally | Near support or after a clear decline |
| Risk point | The height of the candle is often used for stop-loss reference | The low of the candle is often used for a stop-loss reference |
3. Bearish Engulfing
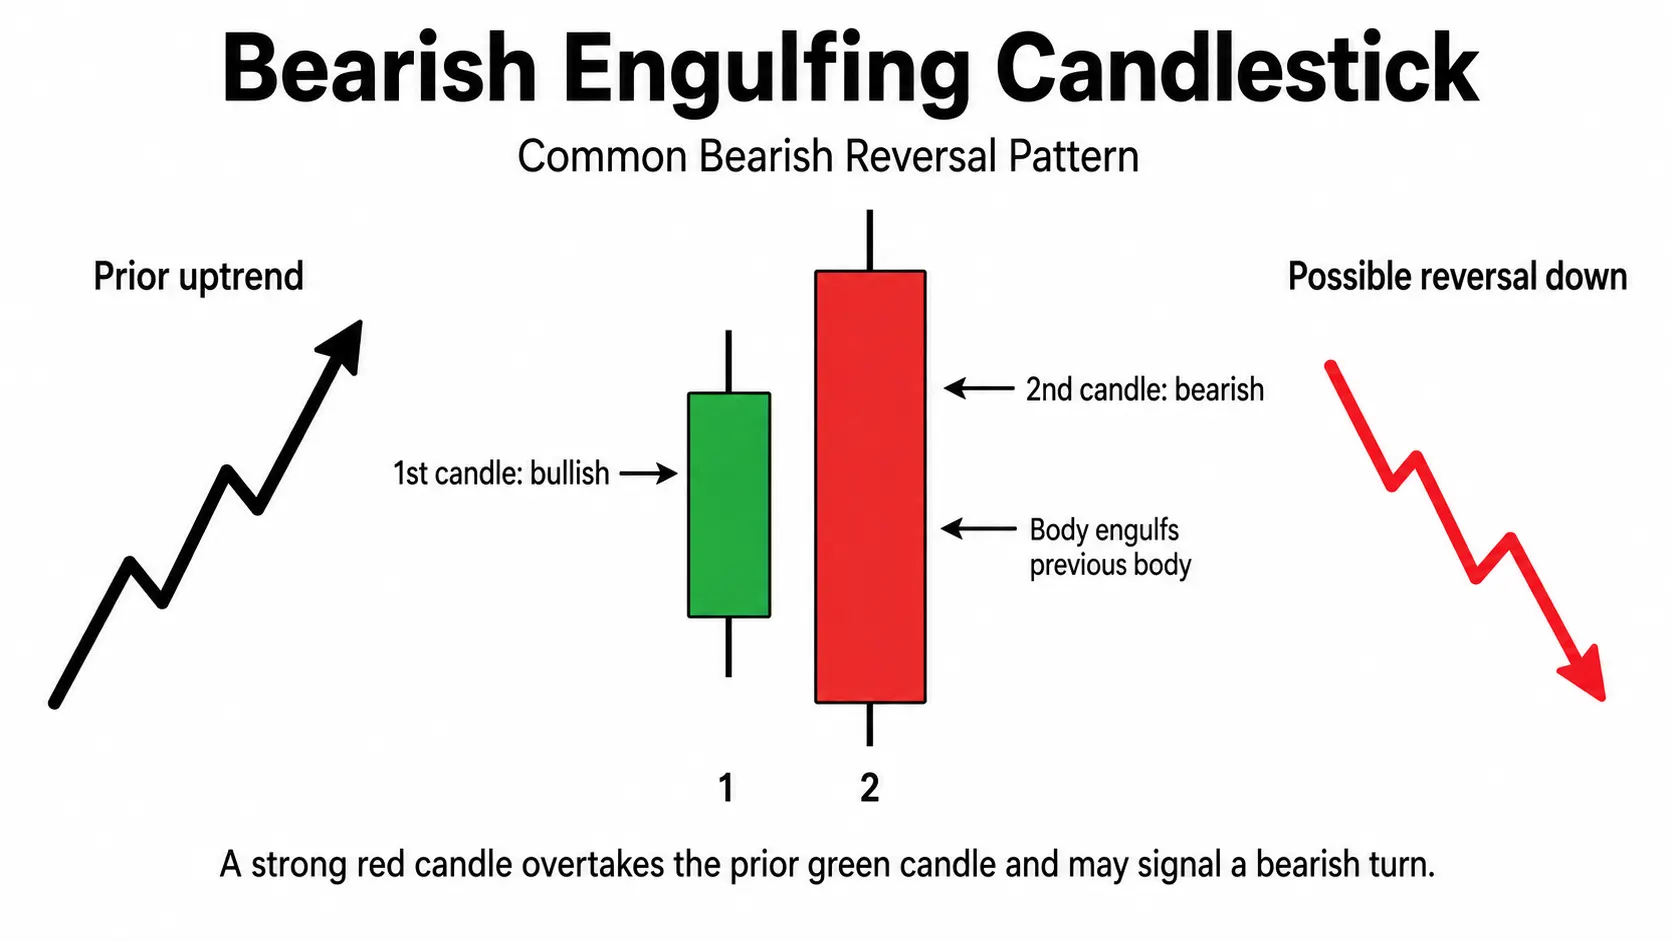
This pattern also uses two candles. The first candle is bullish. The second candle is bearish, and its body completely covers the body of the first candle. That strong reversal in price action can show that seller pressure is taking over after a rise.
In other words, a Bearish engulfing consists of a small bullish candle followed by a larger bearish candle that completely engulfs the previous body, signaling a potential reversal of the upward trend. Moreover, it often occurred at the top but can also occur lower down.
4. Evening Star
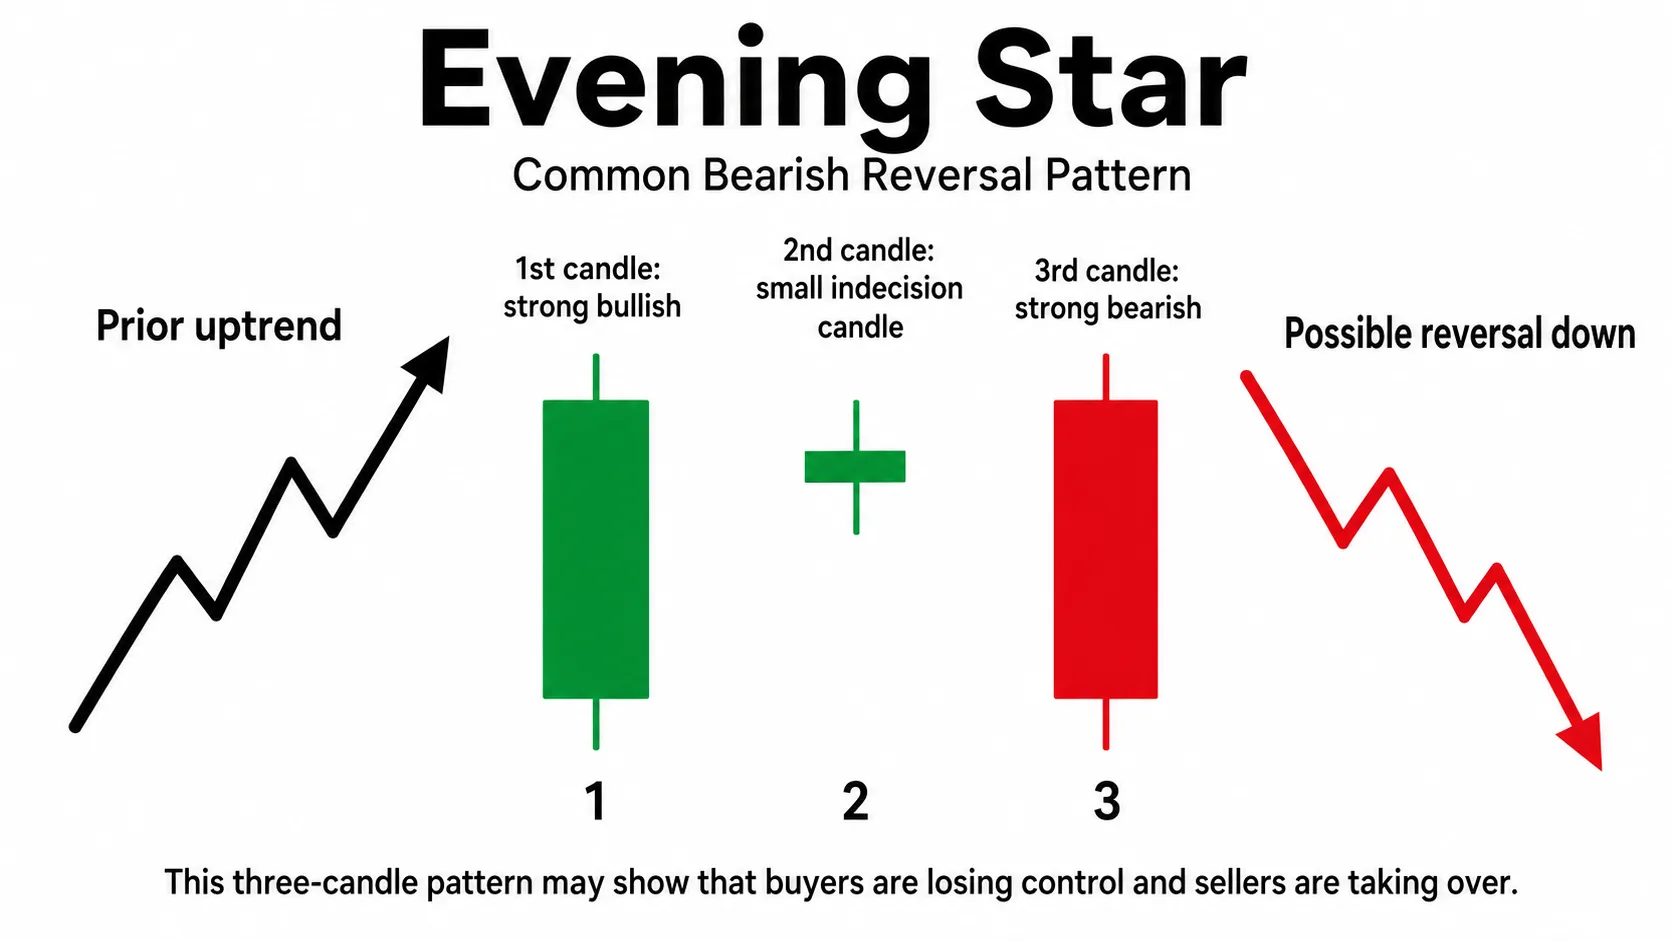
The evening star is the bearish version of the morning star. It is a candlestick formation consisting of 3 candles:
- a strong bullish candle
- a smaller candle showing hesitation
- a strong bearish candle
This sequence can signal that buyers are losing control, and a downward move may follow. The pattern shows a peak in the upward price trend, indicating an impending end of the uptrend. However, the morning star pattern shows an inverse scenario.
4. Dark Cloud Cover
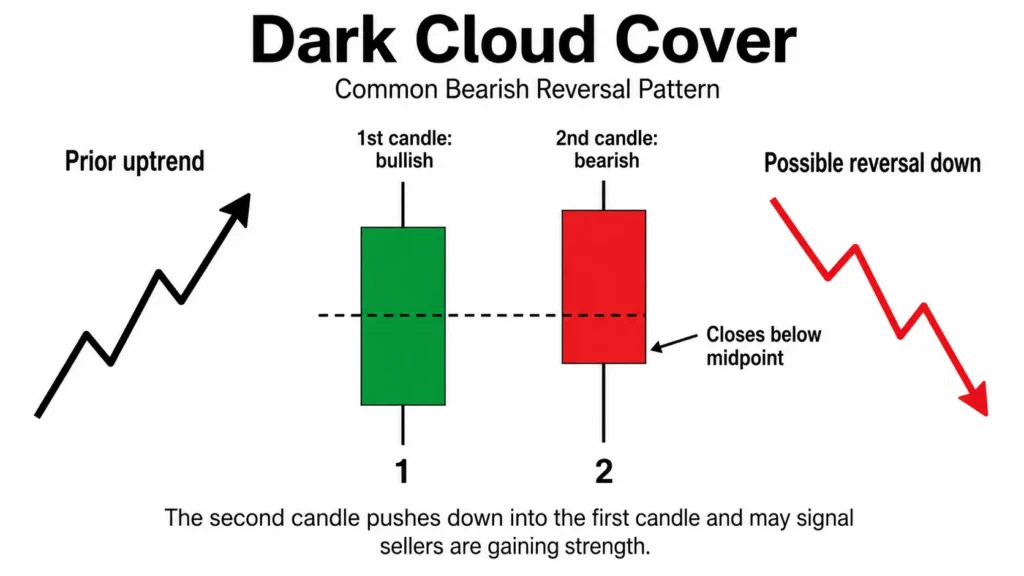
This is another bearish two-candle pattern. The first candle is bullish. The second opens high and then closes below the midpoint of the first candle’s body. That kind of action shows a clear loss of buyer strength and rising seller pressure.
Candlestick Reversal Pattern vs Continuation Pattern
A reversal pattern suggests the current trend may change direction. A continuation pattern suggests the current trend may pause before resuming. For example, a bullish engulfing pattern after a downtrend may suggest a rise. A flag pattern during an uptrend may suggest the trend will continue upward after a pause.
Traders should know the difference because the trade idea changes. Reversal trades try to catch a turning point. Continuation trades try to join an existing trend. Both can be useful. The right choice depends on market structure and trader style.
Common Indicators Referenced Alongside Candlestick Patterns
Candlestick patterns work better when used with other tools. This helps filter weak setups.
- RSI can show overbought or oversold conditions. A bullish reversal pattern near oversold RSI may be more meaningful.
- MACD can help confirm momentum shifts. A bullish crossover near a bullish pattern can add strength.
- Moving averages can help traders define the trend. A reversal pattern near a major moving average can attract more attention.
- Volume can also matter. Strong volume during the reversal can show stronger conviction.
- Support and resistance remain some of the most useful tools. Reversal patterns are often more effective when they form near these levels.
- Fibonacci retracement levels can also help traders spot areas where reversals may happen.
How Reversal Patterns Are Commonly Discussed in Trading Literature
Traders commonly begin by identifying whether the market has been moving clearly higher or lower, as reversal patterns are generally discussed in the context of an established trend. Key price levels, such as support and resistance, are often considered alongside reversal patterns, as formations near these levels are generally regarded as more significant.
Commonly referenced patterns include the hammer, shooting star, engulfing candle, and star formations. Some traders avoid patterns that appear unclear or inconsistent in formation. Many traders look for confirmation from subsequent price action before concluding a pattern, as this is considered a way to reduce false signals.
Risk parameters are typically considered alongside any pattern analysis. In trading literature, a candle’s wick or closing level is commonly referenced when discussing where a pattern may be considered invalid. It is widely noted that not all reversal patterns result in a full trend change. Some may produce only a short-term bounce or pullback, which is why pattern analysis is generally discussed alongside broader trade management considerations.
Frequently Asked Questions
What is the most reliable candlestick reversal pattern?
There is no single most reliable pattern across all markets. Morning star, evening star, and engulfing patterns are widely respected because they show a clearer shift in control.
Can candlestick reversal patterns be used alone?
They can be used alone, but that is not ideal. Results are often better when traders also use support and resistance, indicators, and confirmation candles.
Which time frame is best for reversal patterns?
Higher time frames often give stronger signals. Daily and four-hour charts are common choices. Lower time frames can work too, but they often produce more noise.
Are reversal patterns good for beginners?
Yes. They are one of the easier chart tools to learn. Still, beginners should focus on context, confirmation, and risk management.
Risk Warning: CFDs are complex financial instruments and carry a high risk of rapid loss of money due to leverage. You should ensure you fully understand the risks involved and carefully consider whether you can afford to take the high risk of losing your money before trading.
Disclaimer: The information is provided for educational purposes only and doesn’t take into account your personal objectives, financial circumstances, or needs. It does not constitute investment advice. We encourage you to seek independent advice if necessary. No representation or warranty is given as to the accuracy or completeness of any information contained within. This material may contain historical or past performance figures and should not be relied on.
Furthermore, estimates, forward-looking statements, and forecasts cannot be guaranteed. The information on this site and the products and services offered are not intended for distribution to any person in any country or jurisdiction where such distribution or use would be contrary to local law or regulation.
References
- https://en.wikipedia.org/wiki/Candlestick_pattern Candlestick pattern
- https://www.investopedia.com/terms/h/hammer.asp – Hammer Reversal Candlestick Pattern: What it is
- https://marketinvestopedia.com/shooting-star-pattern-in-trading/ Shooting Star Pattern in Trading
- https://www.investopedia.com/terms/b/bearishengulfingp.asp Bearish Engulfing Pattern: Definition and Example of How To Use
- https://www.babypips.com/forexpedia/evening-star Evening Star
- https://www.vantagemarkets.com/en-za/academy/best-trading-indicators/ Best Trading Indicators for 2026
- https://groww.in/p/piercing-candlestick-pattern Piercing Candlestick Pattern