
 Updated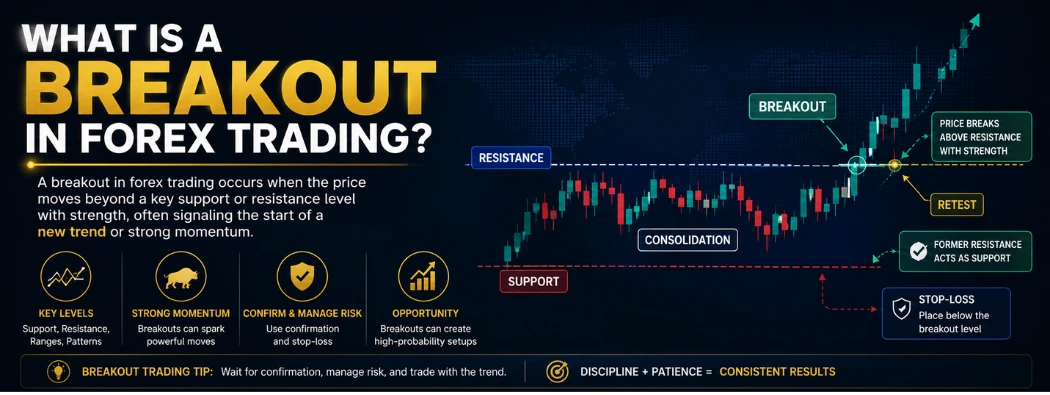
A breakout in forex trading occurs when the price moves beyond a strong, critical level with strength. That crucial level is commonly support, resistance, or the boundary of a chart pattern such as a range, triangle, or channel.
This is important as breakouts are often the point at which the market takes off and transitions from quiet movement into a strong move. That is where real trading opportunities start for many traders.
But there is a catch.
Breaking resistance or support does not make a breakout. Some moves fail fast. Price penetrates the level, closes traders inside, then reverses aggressively. This is what makes breakout trading difficult for so many new traders. They see the move, jump in early and get stuck.
A definition is not enough to really understand breakouts. You have to understand what triggers them, how to avoid them, how to verify them and how to hedge against the risk they pose.”
What is Breakout Strategy in Forex Trading?
A breakout strategy in forex trading is an approach in which a trader looks for the price to move through a key support or resistance level and then trades in the direction of that move. The idea is that once price clears an important barrier, it may signal a new trend or the start of stronger momentum. Traders often use breakout setups after the price has been moving in a tight range or forming patterns such as channels or triangles.
For example, if EUR/USD breaks above a clear resistance zone, a trader may open a buy position. If the price falls below support, the trader may look for a sell trade. Many traders wait for additional confirmation before entering, such as a candle closing above the level or a retest of the broken area. This helps reduce the chance of reacting to a weak move.
This strategy can be useful, but it also carries risk. Some moves fail and become false breakouts, in which the price breaks a level only to quickly reverse. Because of that, traders often use stop-loss orders and clear risk rules.
Why Breakouts Happen
Breakouts do not happen by chance. They typically occur when pressure has been building. Support and resistance are like walls. Repeatedly testing a price against a barrier can erode that barrier. Resistance gets broken when sufficient buying pressure builds. If enough selling pressure accumulates, support fails.
Here are some common reasons why breakouts occur:
- Market pressure builds over time: When the price keeps pushing against a level, it can show growing interest from buyers or sellers. For example, if the price keeps testing resistance and pulling back only a little each time, buyers may be growing stronger.
- News changes market expectations: Major news can trigger breakouts fast.
Examples include:
- interest rate decisions
- inflation data
- employment data
- central bank statements
- major political or economic shocks
These events can change trader expectations in seconds.
- Trend Continuation: Sometimes a market pauses during an existing trend, then breaks out in the same direction. In that case, the breakout acts like a continuation signal.
- Trend Reversal: A breakout can also mark the end of an old move. If a major support level fails after repeated tests, the market may be starting a bearish turn. The same idea applies in reverse for resistance.
Types of Breakouts in Forex Trading
Breakouts usually fall into four broad groups: range breakouts, continuation breakouts, reversal breakouts, and news-driven breakouts. As mentioned earlier, a breakout happens when the price moves above resistance or below support and begins trading outside that area with enough force to suggest a change in direction or momentum.
Support and resistance matter because they often mark the zones where price has paused, reversed, or struggled to move through in the past.
1. Range Breakout
It appears that the price has been moving between a clear high and a clear low for some time. When price escapes that box, traders often treat it as a sign that the market is leaving consolidation and may start a stronger move.
For example, imagine EUR/USD trades between 1.0800 and 1.0850 for several hours. If the price closes above 1.0850, that could be viewed as a bullish range breakout. If it falls below 1.0800, that would be a bearish range breakout.
2. Continuation breakout
It happens when an existing trend pauses, forms a smaller pattern or consolidation, and then breaks in the same direction as the earlier move. Technical analysis commonly treats continuation patterns as signs that the broader trend may still be active.
For example, if GBP/USD is already rising, then pauses in a tight band before pushing above the recent high, that move may point to trend continuation rather than a new reversal.
3. Reversal Breakouts
It suggests that the prior trend may be weakening or coming to an end. This type appears when the price breaks an important level that had been holding the market in its old direction.
For example, if USD/JPY has been falling for some time but then breaks above a major resistance area, traders may read that as an early sign of a possible bullish reversal.
4 News-driven breakout
This follows a major economic release or central bank event. Economic data is a major short-term catalyst in forex, and traders often watch for consolidation before the release and a breakout after.
For example, a strong U.S. jobs report could push EUR/USD sharply below support within minutes. These setups can be powerful, but they can also fail, so confirmation and risk control still matter.
Where breakouts often appear
Breakouts do not happen at random. They tend to form around clear chart structures.
1. Support and resistance: These are the levels most traders learn first. If price moves above resistance or below support, traders watch closely for follow-through.
2. Trading ranges: A range forms when the price moves between a high and a low without trending clearly. A break above the range high or below the range low can start a stronger move.
3. Chart patterns: Breakouts can come from patterns such as:
- triangles
- rectangles
- flags
- pennants
- wedges
- channels
These chart patterns often show a market that is pausing, tightening, or deciding on its next move.

3. Session highs and lows: Some forex traders also watch session ranges, including the Asian, London, and New York sessions. A move beyond a key session level may attract attention.
Forex Breakouts Trading Strategies
1. Support and resistance breakout strategy
One of the most common methods. The trader marks a level that the price has respected several times and waits for a firm move beyond it.
For example, if EUR/USD has repeatedly stalled near 1.1000 and then closes above that area, some traders may view that as a bullish breakout. The same logic applies in reverse when the price closes below support. This strategy works best when the level is clear, and the move beyond it is decisive rather than brief or erratic.
2. Retest breakout strategy
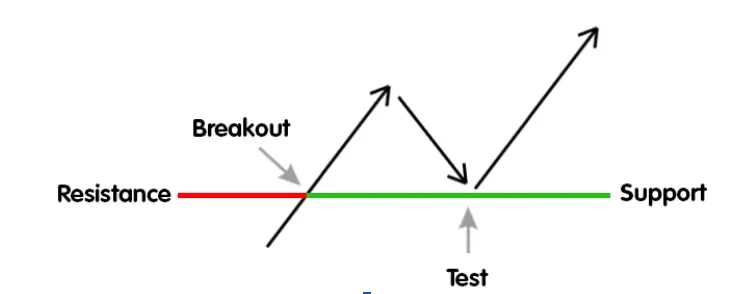
In this strategy, some people do not enter during the first break. Rather than entering on the first move, the trader waits to see whether the price returns to the broken level and holds above or below it. A former resistance level may act as support after an upside break, while a former support may act as resistance after a downside break. This approach can help reduce the risk of reacting to a short-lived spike and often gives a clearer point for setting trade risk.
3. Continuation-pattern breakout strategy
Technical analysts often watch formations such as triangles, rectangles, flags, and pennants for signs that a trend may resume after a pause. In practice, the trader first identifies the broader trend, then looks for the price to break out of the smaller pattern in the same direction.
For example, if GBP/USD is trending higher and then forms a triangle before breaking above its upper boundary, that move may be read as a continuation of the earlier uptrend rather than a fresh reversal.
4. Failed breakout strategy
A failed breakout occurs when price moves beyond a level but cannot hold there and then falls back into the prior range. In this case, the failure itself becomes the key signal.
For example, if USD/JPY breaks above resistance but quickly slips back below it, some traders interpret the weakness as a sign that the upside move lacked conviction. This type of setup requires patience because the trader is not acting on the first break but on the market’s inability to sustain it.
5. News breakout strategy
Major economic releases, central bank decisions, and labour or inflation data can cause sharp price moves in currency pairs. Some traders watch for consolidation ahead of a scheduled release, then assess whether the post-news move breaks a key level and shows follow-through. This strategy can be effective in active markets, but it also carries added risk because volatility can rise quickly and reversals can happen without much warning
How Traders Confirm a Breakout
Many beginners make the mistake of treating every level break as a trade signal. A more careful approach is to wait for confirmation. Common confirmation methods include:
1. Choose an entry method that fits your plan. There is no single way to enter a breakout trade. traders often use two common approaches, which are:
- Early Entry Approach: It involves entering soon after the price breaks the level.
- Confirmed Entry Approach: It involves waiting for an added confirmation, such as a candle close or a retest.
2. Look for confirmation before you enter. Common forms of confirmation include;
- a candle close above resistance or below support. This is one of the simplest ways.
- a retest of the broken level
- momentum support from tools like RSI or MACD,
- a breakout that occurs during active trading sessions
3. Use a stop loss to manage risk. A stop-loss is often placed:
- below the broken resistance in a bullish breakout
- above the broken support in a bearish breakout
- beyond a recent swing high or swing low
Common breakout trading mistakes
Breakout trading is simple to describe, but many traders still make avoidable errors.
- Entering too early: A trader sees a price nearing a level and jumps in before the break is confirmed.
- Ignoring the wider trend, a breakout that runs counter to the broader market direction may be less reliable.
- Trading every breakout: Not every setup is worth taking. Some occur in weak market conditions or in unclear structures.
- Overlooking news risk: Economic releases can trigger sharp price moves but also create rapid reversals and market instability.
- Poor stop placement: A stop that is too tight may be hit by normal price swings. A stop that is too wide may create poor trade management.
Common Breakout Indicators
Breakout indicators help traders judge whether a move beyond support or resistance is likely to hold. In forex trading, indicators are usually used to confirm the setup, not to replace chart reading.
1. Bollinger Bands
It was created by John Bollinger in the 1980s. Bollinger Bands are useful for spotting changes in volatility. When the bands narrow or squeeze, it often means the market is quiet, and the price is compressing. This type of setup can come before a breakout. If the bands begin to widen after a price breakout, it may suggest that momentum is building.
2. Support and Resistance
Support and resistance are the foundation of breakout trading. It is more of a foundational indicator. A breakout becomes more meaningful when the price moves through a level that has already been tested several times. These zones show where buyers or sellers have reacted in the past, so a clear move beyond them can suggest a change in market direction or momentum.
3. Moving Averages
A trend and confirmation tool. Moving averages are often used to understand the trend. They can help traders see whether a breakout is moving with the market’s main direction. In some cases, moving averages also act as dynamic support or resistance, adding more context to the setup.

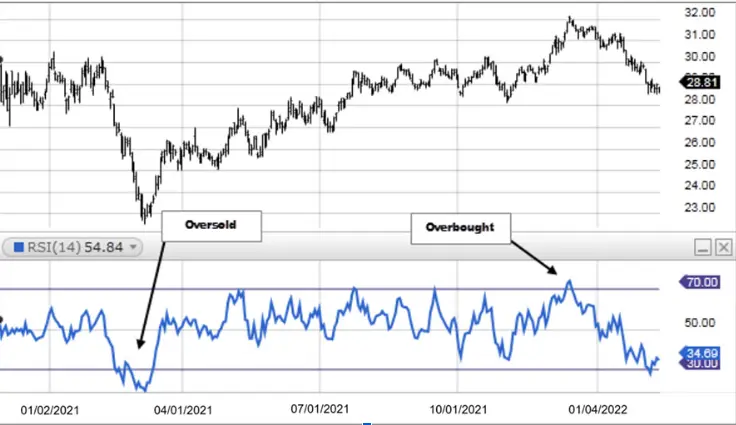
4. Relative Strength Index (RSI)
RSI is a momentum tool that helps traders measure the speed and change of price movements, oscillating between 0 and 100. In other words, RSI helps determine when a security is overbought or oversold. If price breaks a key level and RSI also shows strong momentum, the move may have more support behind it. RSI can also help traders notice when momentum is weakening, which may point to a possible false breakout.
5. Moving Averages Convergence Divergence
MACD is another indicator used to confirm momentum and trend direction. Traders often watch for signal line crossovers or a rising histogram to support a breakout idea. It is most useful when combined with price action rather than used on its own.
6. Volume or Tick Volume
Volume can help show whether there is enough market activity behind a breakout. In forex, traders often rely on tick volume from their trading platform since the market is decentralised. While it is not a perfect measure of total market volume, it can still offer clues about the strength of a move.
Risk management in breakout trading
This is the part many new traders do not think about enough.
Even a strong breakout can fail. That is why risk management matters more than trying to predict every move correctly.
1. Stop-loss placement: In a bullish breakout, some traders place a stop below the breakout level or below the retest low. In a bearish breakout, some place it above the broken support or above the retest high.
The goal is simple: place the stop at the level where the trade idea would likely be invalid.
2. Profit targets: Traders often use one of these methods:
- the next support or resistance zone
- a measured move based on the size of the pattern
- a fixed risk-to-reward target
- a trailing stop in a strong trend
There is no perfect exit method. What matters is using a plan that matches the setup and your risk tolerance.
Frequently Asked Questions
What is a breakout in forex trading?
A breakout in forex trading occurs when the price moves beyond a clearly defined support or resistance level. This type of move can suggest that the market is gaining momentum and may be preparing for a new trend.
Why do traders pay attention to breakouts?
Breakouts can signal a shift in market direction or the start of a stronger price move. For this reason, many traders monitor them closely when looking for potential entry points.
How can a breakout be confirmed?
A breakout is often confirmed when the price closes clearly above resistance or below support. Some traders also look for added signs, such as stronger momentum or a successful retest of the broken level.
What is a false breakout in forex?
A false breakout happens when price moves past a key level but fails to continue and returns to its earlier range. This can mislead traders who enter too soon without waiting for confirmation.
Which indicators are commonly used in breakout trading?
Traders often use tools such as Bollinger Bands, RSI, MACD, moving averages, and volume-based indicators to support breakout analysis. These tools can help assess momentum, volatility, and the strength behind the move.
Is breakout trading a good option for beginners?
Breakout trading can be accessible for beginners because the concept is fairly straightforward, though it carries real risk and requires disciplined risk management before trading with real capital.
How do traders manage risk when trading breakouts?
Risk is usually managed by placing a stop-loss beyond the breakout level and keeping position size under control. This helps limit losses if the trade does not develop as expected.
Risk Warning: CFDs are complex financial instruments and carry a high risk of rapid loss of money due to leverage. You should ensure you fully understand the risks involved and carefully consider whether you can afford to take the high risk of losing your money before trading.
Disclaimer: The information is provided for educational purposes only and doesn’t take into account your personal objectives, financial circumstances, or needs. It does not constitute investment advice. We encourage you to seek independent advice if necessary. The information has not been prepared in accordance with legal requirements designed to promote the independence of investment research. No representation or warranty is given as to the accuracy or completeness of any information contained within.
This material may contain historical or past performance figures and should not be relied on. Furthermore, estimates, forward-looking statements, and forecasts cannot be guaranteed. The information on this site and the products and services offered are not intended for distribution to any person in any country or jurisdiction where such distribution or use would be contrary to local law or regulation.
References
- https://www.investopedia.com/terms/b/breakout.asp – Breakout: Definition, Example and What it Tells You
- https://www.vantagemarkets.com/en-za/academy/basics-of-support-and-resistance/ – The Basics of Support and Resistance
- https://www.investopedia.com/articles/forex/05/tradingonnews.asp – How To Trade Forex on News Releases
- https://www.dailyforex.com/forex-articles/2009/11/forex-trading-breakouts/2830 – Forex Trading Breakouts: How To Identify.
- https://en.wikipedia.org/wiki/Relative_strength_index – Relative Strength Index
- https://www.litefinance.org/blog/for-beginners/best-technical-indicators/technical-indicators-list/ – Best Technical Indicators
- https://en.wikipedia.org/wiki/Moving_average – Moving Average