
 Updated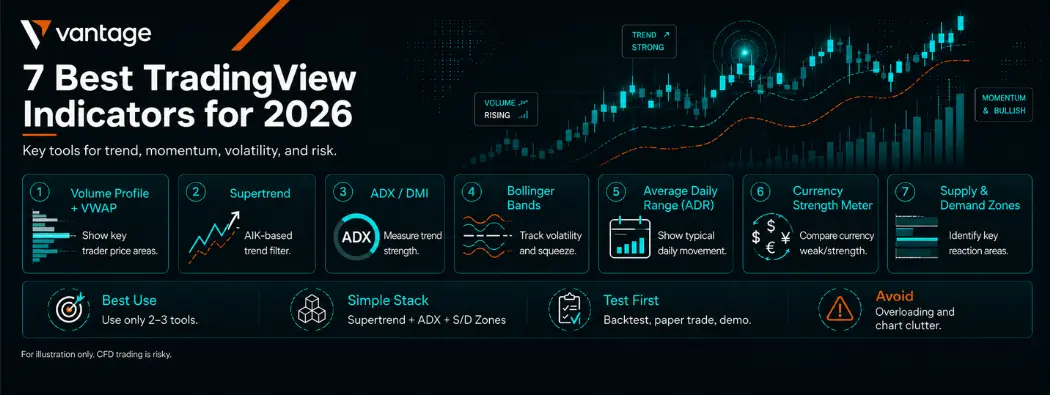
Most active traders do not need another random list of indicators. They need a clean way to decide which indicators deserve space on their chart.
TradingView has thousands of built-in and community-made indicators. Many look good after the move. Far fewer help when the price is moving live, spreads are widening, or news is about to hit.
Different indicators may help improve market reading, while others may add unnecessary noise depending on how they are used. Others can make charts cluttered, reducing clarity in decision-making.
The best TradingView indicators for 2026 are not the flashiest ones. They are the ones that solve a clear trading problem.
A good indicator should help you answer one of these questions:
- Is the market trending or ranging?
- Will momentum be strong or weak?
- Is volatility rising or falling?
- Where should I manage risk?
- Is the price near an area where traders may react?
What makes a TradingView indicator worth using for forex?
A good TradingView indicator for forex should help you make clearer decisions, not crowd your chart. From a trader’s experience and what traders often say on forums, the best tools are the ones that answer one simple question: Is price trending, losing steam, getting volatile, or reacting at a key level?
Some indicators lead, while others lag. Leading tools, like RSI divergence or Bollinger Band squeezes, can warn you before a possible move. Lagging tools, like EMAs, MACD, ATR, Supertrend, and Volume Profile, help confirm what price is already doing.
Another thing traders should watch is repainting. A repainting indicator can change past signals, making results look better than they were in real time.
That is why these seven picks are safer, standard, non-gimmick tools. Most are built into TradingView, while Supertrend is easy to find as a free community script.
1. Volume Profile (+ VWAP)
Volume Profile shows where trading activity happened at each price level. Unlike normal volume bars, which show how much volume came in during a candle, Volume Profile shows where volume actually traded on the chart.
On TradingView, go to Indicators, search Volume Profile, then choose a built-in option like Visible Range Volume Profile or Session Volume Profile.
The Visible Range Volume Profile is commonly used on lower timeframes, such as 15-minute, 1-hour, or 4-hour charts. It helps you see high-volume nodes, low-volume areas, and the Point of Control, which is the price zone with the most traded activity.
For example, if EUR/USD keeps bouncing from a high-volume node, that zone may act as support. If price breaks away from a low-volume area, it can move faster because fewer trades happened there before.
VWAP is also useful for intraday traders and scalpers. It helps show the average price weighted by volume, so traders can judge whether the price is trading above or below the fair intraday value.
The main risk is forex volume. FX is not centralised like futures, so TradingView volume depends on the broker or data feed.

2. Supertrend
Supertrend is one of those TradingView indicators that keeps things simple. It shows trend direction using ATR, so it reacts to both price movement and volatility.
When the price flips above the Supertrend line, it signals a possible buy bias. When the price flips below it, it signals a possible sell bias.
The common default setting is ATR period 10 with a multiplier of 3. For forex, a calmer setting, such as ATR 10 with a multiplier of 4 or ATR 14 with a multiplier of 3, is often preferred. It reduces some noise, especially on pairs that spike often.
Supertrend works best as a trend filter, not a blind entry tool.
For example, if EUR/USD is above the Supertrend line on the 1-hour chart, traders often view pullbacks as occurring within an overall upward trend bias. The same line can also help trail stops as the trade moves in profit.
The risk is that Supertrend can whipsaw badly in ranging markets. Price may flip above and below the line several times. Pairing it with ADX can help, since ADX shows whether the market has enough trend strength.
3. ADX/DMI (Average Directional Index/Directional Movement Index)
Developed by J. Welles Wilder, the ADX/DMI (Average Directional Index/Directional Movement Index) is a three-line system. ADX measures how strong a trend is, while the +DI and −DI lines reveal direction: bullish pressure vs bearish pressure.
Crucially, ADX itself tells you nothing about the direction of price movement. On its own, ADX is an entry risk-reducer, not an entry trigger.
The classic setup: wait for +DI to cross above −DI (bullish) or −DI to cross above +DI (bearish), then only act when ADX is above 25. Paired with Supertrend, ADX becomes a confirmation gate. Supertrend fires the entry signal; ADX validates that a real trend backs it.
Because ADX is a smoothed, lagging indicator, it often peaks after the strongest portion of the move. You may enter late or hold through reversals.
Never use a rising ADX alone as a buy signal; always confirm direction with the DI lines or a price-action tool like Supertrend.
4. Bollinger Bands
Bollinger Bands are essentially a volatility envelope around price. You’ve got three lines: an upper band, a lower band, and a midline in between. When the market becomes active and volatile, those bands widen. When things go quiet and choppy, the bands contract tight.
The default TradingView setting is a 20-period moving average with 2 standard deviations. That midline, by the way, is just a moving average. If you’re not familiar with moving averages, it may be helpful to review them before using Bollinger Bands.
Now, the squeeze is the setup everyone gets excited about. When the bands pinch together really tight, the market is coiling, and historically, a big move follows. The squeeze doesn’t tell you which direction, just that something’s coming.
For mean-reverting conditions, price touching the upper or lower band is sometimes associated with a move back toward the midline. In breakout conditions, a strong candle closing outside the band after a squeeze is often noted as a possible continuation signal.
ATR helps here because it provides a better way to size stops than guessing.
The risk is simple: the bands are not buy or sell signals on their own. The midline is simply a moving average.
5. Average Daily Range (ADR)
It calculates the daily high-low price range for a target currency pair and generates a numerical value by averaging the range over 5 to 20 trading days. This indicator can only measure the scope of price fluctuations and cannot indicate future price trends.
If EUR/USD has already moved 75 pips and its average daily range is around 85 pips, it may suggest that a large portion of its typical daily movement has already occurred.
For a pair with an ADR of around 90 pips, very tight stop-loss levels are more likely to be affected by normal price fluctuations.
ADR is often used to understand whether price has already moved significantly relative to its average daily range. If a pair has already moved close to its average daily range, this may suggest that less movement remains within that range.
For example, if EUR/USD has already covered most of its ADR before New York opens, a fresh breakout may have less room left. With USD/ZAR, the range may still be wider, but the swings can also be more aggressive.
High-impact economic events, such as data from the US Fed or unexpected NFP news releases, may lead to a sudden spike that far exceeds the average daily range (ADR). These movements can render ADR data ineffective, so treat it as a guideline rather than an absolute rule. To protect your capital, always cross-reference the economic calendar alongside your ADR data.
6. Currency Strength Meter
A Currency Strength Meter can display the relative strength of each currency against others. Instead of looking at one pair alone, it helps you spot which currency is strong and which one is weak. That makes it useful for finding strong vs. weak pair setups.
You can use it more for choosing which pair to trade, not just when to enter. For example, if USD is the strongest currency and JPY is the weakest, USD/JPY is sometimes seen as a clearer expression of that strength-versus-weakness difference than a pair where both currencies are mid-ranked.
The idea is simple: this approach focuses on identifying relative strength and weakness between currencies and waiting for price action confirmation.
On TradingView, most Currency Strength Meter tools are free community scripts. They may track major currencies like USD, EUR, GBP, JPY, AUD, CAD, CHF, and NZD, then rank them by recent performance.
The biggest pitfall is that this data is lagging and purely relative. It highlights past strength or weakness rather than predicting the next move with certainty. To stay safe, you should always validate these signals against market structure, support and resistance, current trend bias, and the prevailing news environment.
7. Supply & Demand Zones
Supply and demand zones show areas where the price has reacted strongly before. In simple terms, a demand zone is where buying pressure may return, while a supply zone is where selling pressure may come back.
On TradingView, some tools can auto-mark these institutional-style zones and support/resistance areas, but you can still check them manually.
These zones can be read in three ways: entry, target, and invalidation. A rejection when price returns to a demand zone is often interpreted as renewed buying interest. A supply zone above is often viewed as a potential target area.
If price breaks clearly below the demand zone, the idea is usually invalid. The same logic works in reverse for sell setups.
Supply and demand zones work better with confluence. For example, if a EUR/USD demand zone lines up with a high-volume area on the Volume Profile, you pay more attention. This suggests the price is reacting near an area where significant activity previously occurred.
The main risk is that auto zones are not perfect. They still need human judgment. Zones can weaken, fail, or break completely.
Other Useful TradingView Indicators
Awesome Oscillator:
The Awesome Oscillator helps gauge momentum without relying on RSI or MACD. It is often used to identify momentum shifts and divergence, especially when price makes a new high or low but momentum does not follow.
Williams Fractals:
Williams Fractals mark short-term swing highs and lows. They suit traders who like structure, breakout levels, and cleaner stop placement around recent market turns.
Zig Zag:
Zig Zag filters out small price noise and highlights major swings. It suits swing traders who want to see trend structure, higher highs, lower lows, and key pullbacks more clearly.
Bull Bear Power:
Bull Bear Power shows whether buyers or sellers have more pressure behind the move. It suits traders who want an extra-strength check before entering with the trend.
How to Combine These Indicators Without Overloading Your Chart
The goal is not to add more indicators. The goal is to build confluence. That means using different tools that confirm the same trade idea from different angles.
A clean setup should have only 2–3 non-correlated indicators. For example, use one trend tool, one strength or volatility tool, and one structure tool. Do not stack five momentum indicators that all tell you the same thing.
A simple forex stack could be Supertrend + ADX + Supply/Demand Zones.
Supertrend indicates the trend bias for you. When price is above the Supertrend, it is generally interpreted as an upward trend bias. When price is below it, it is generally interpreted as a downward trend bias.
ADX tells you whether the trend has enough strength. If ADX is below 20, the market may be too weak or choppy.
Supply and demand zones help you plan entries, targets, and invalidation.
For example, when GBP/USD is above Supertrend, and ADX is above 25, and price pulls back into a demand zone, this combination is often used to assess whether bullish trend conditions are present.
More indicators do not mean more accuracy. Too many tools can create mixed signals, late entries, and doubt. A simple chart with clear rules is usually stronger than a crowded one.
How to Add an Indicator on TradingView
Adding indicators on TradingView is simple once you know where to look. It is generally recommended to start with one or two tools first, then add more only when they serve a clear purpose.
Desktop
- Open your TradingView chart.
- Click Indicators on the top toolbar.
- Type the indicator name into the search bar, such as RSI, MACD, Supertrend, or Volume Profile.
- Click the indicator name to add it to your chart.
- Click the star icon beside the indicator name to favourite it for faster access later.
- To edit it, click the gear icon beside the indicator name on your chart.
- To remove it, click the trash icon or open the indicator menu and select Remove.
Mobile
- Open the TradingView app and load your chart.
- Tap the Indicators option, usually found on the chart toolbar or plus menu.
- Search for the indicator name.
- Tap the indicator to apply it.
- Use the star icon to favourite tools you use often.
- To hide it, tap the eye icon beside the indicator name.
- To remove or edit it, open the indicator legend, then use the trash or settings option.
For forex traders, favouriting your main tools saves time when switching between pairs and timeframes.
How to Test These Indicators Before You Risk Money
Before risking real money, test every indicator in three steps. First, backtest it on past charts and record clean wins, losses, and false signals.
Next, paper-trade it on TradingView to see how it behaves in real time. Then use a demo account during active forex sessions, such as London or New York.
Do not copy settings mindlessly. Test each indicator on your own pairs, timeframe, and trading style. If the setup fails in the demo, it is not ready for live trading.
Common Mistakes Intermediate Traders Make With Indicators
One common mistake is over-optimising settings until an indicator looks perfect on past charts. That is curve-fitting. It may look great in a backtest, but fail when live market conditions change.
Another mistake is chasing the “most accurate” indicator. No indicator is always right. A better goal is to understand what each tool does: trend, momentum, volatility, or structure.
Many traders also ignore market context. RSI, MACD, or Supertrend can behave very differently during news, low liquidity, or a ranging market. A good signal under the wrong conditions can still cost money.
Over-trading is another big one. Not every signal deserves a trade. Sometimes the best decision is to wait.
The psychology side matters too. FOMO can lead traders to enter late, while revenge trading after a false signal can worsen losses. Indicators should guide decisions, not control emotions.
Frequently Asked Questions
What are the best TradingView indicators for forex?
The best TradingView indicators for forex include EMAs, RSI, MACD, ATR, Supertrend, Bollinger Bands, ADX/DMI, Volume Profile, ADR, and Currency Strength Meter.
Which TradingView indicator is the most accurate?
No indicator is always accurate, so use confluence between trend, momentum, volatility, and structure tools.
Are these TradingView indicators free?
Most are free, built-in TradingView indicators, while others are available as free community scripts.
How do I add an indicator on TradingView?
Open your chart, click Indicators, search the indicator name, then click it to add it.
How many indicators should I use at once?
Use two or three non-correlated indicators at most to avoid chart overload.
Can I use these indicators on MT4 or MT5?
Many standard tools are available on MT4/MT5, but TradingView community scripts may require a custom MT4/MT5 version.
What is the best volume indicator on TradingView?
Volume Profile is one of the best volume tools because it shows where trading activity happened by price level.
What’s the best TradingView indicator for scalping forex?
Supertrend, VWAP, EMA, ATR, and ADX can work well for scalping when used with price action.
What does “repainting” mean, and why does it matter?
Repainting means an indicator changes past signals, which can make live results look better than they were.
Do these indicators work on the TradingView mobile app?
Yes, most built-in indicators and many community scripts work on the TradingView mobile app.
Risk Warning: CFDs are complex financial instruments and carry a high risk of rapid loss of money due to leverage. You should ensure you fully understand the risks involved and carefully consider whether you can afford to take the high risk of losing your money before trading.
Disclaimer: The information is provided for educational purposes only and doesn’t take into account your personal objectives, financial circumstances, or needs. It does not constitute investment advice. We encourage you to seek independent advice if necessary. No representation or warranty is given as to the accuracy or completeness of any information contained within.
This material may contain historical or past performance figures and should not be relied on. Furthermore, estimates, forward-looking statements, and forecasts cannot be guaranteed. The information on this site and the products and services offered are not intended for distribution to any person in any country or jurisdiction where such distribution or use would be contrary to local law or regulation.