
 Register
 Login
Login Register


Top Three Markets to Watch This Week: Gold, EUR/USD, and USD/JPY

Hebe Chen >
Senior Market Analyst
Hebe Chen >
Senior Market Analyst
 Updated Wed, 2025 July 2 04:28

This week marks a critical transition as we close out the first half of the year. It’s typically a time for investors to reset—but the market isn’t offering much breathing room. Trade tensions are back in focus, with Trump ruling out any extension to the July 9 deadline. His renewed threat to slap tariffs on key partners like Japan rattled sentiment, prompting Wall Street to ease off on Tuesday.
On the data front, the U.S. jobs report is the key swing factor. While the labor market has held firm, any signs of softening could quickly recalibrate rate cut expectations.
U.S. stocks have reclaimed all-time highs for the first time since February, but the road into H2 looks anything but smooth. Gold, meanwhile, is catching a bid—up over 1% this week—as safe-haven demand picks up on the back of tariff risks and the Senate’s passage of Trump’s “big, beautiful bill.”
Here’s a technical breakdown of this week’s three key markets:
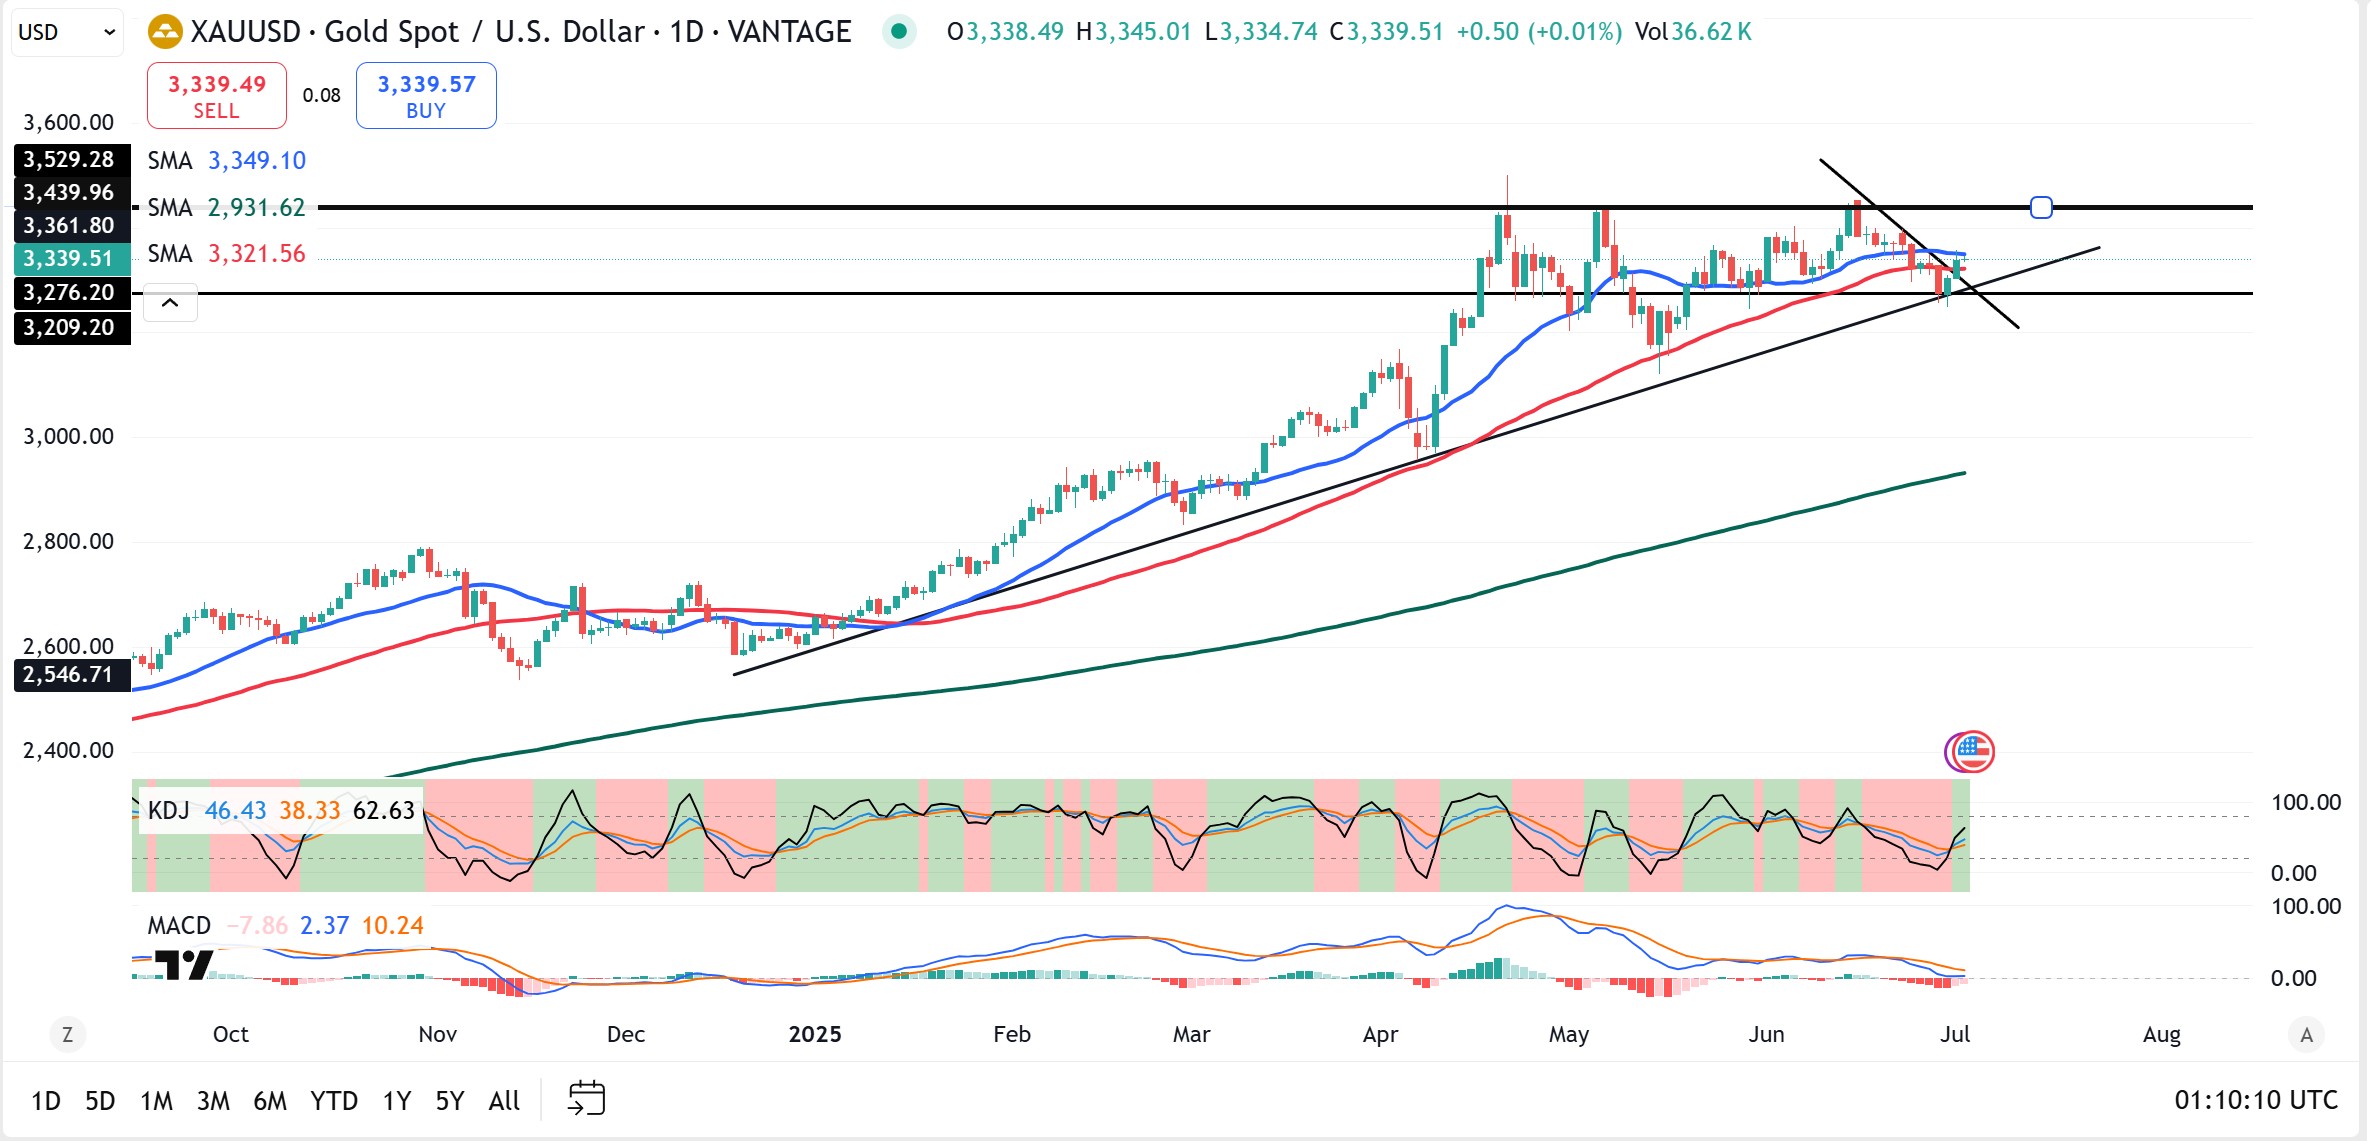
Gold/USD (Daily Chart)
Gold is attempting a breakout after more than two months of consolidation. Price action is holding above trendline support and pushing through descending resistance. The SMA cluster between $3,320 and $3,350 provides a solid base, while $3,440 and $3,529 cap the upside.
Momentum is starting to rebuild, with MACD nearing a bullish crossover and KDJ turning higher. A confirmed breakout above $3,440 would open the door to new highs, while a drop below $3,275 could trigger deeper pullbacks. Structurally, the long-term uptrend remains intact with a series of higher lows.
EUR/USD (Weekly Chart)
EUR/USD has rallied over 15% off its February 2025 low, blasting through key resistance at 1.1450 and 1.1726. It’s now testing the 1.19–1.20 zone—last visited during the 2021 double-top.
Momentum remains strong, supported by a steep bullish slope and MACD crossover. KDJ is deep in overbought territory but hasn’t diverged yet. If momentum fades, a retest of 1.1726 could mark the end of the four-month uptrend. That said, the broader bullish bias holds as long as 1.1450 remains intact. A clean break above 1.2020 could clear the way toward 1.22.

USD/JPY (Daily Chart)
USD/JPY is tightly coiled inside a symmetrical triangle, hovering above rising support near 142. The neckline resistance at 146.80 forms part of a classic head-and-shoulders setup. A breakdown below 141.20 would confirm bearish continuation toward 139.80, while a breakout above 146.0 would invalidate the pattern and point toward 149+.
Momentum remains mixed—KDJ is turning up from oversold, and MACD shows early signs of bullish divergence. Expect consolidation to continue between 141 and 145 through July, with a decisive breakout setting the tone for H2—either a move to fresh lows or a reversal toward multi-month highs.

Disclaimer: The material provided here has not been prepared in accordance with legal requirements designed to promote the independence of investment research and as such is considered to be a marketing communication. Whilst it is not subject to any prohibition on dealing ahead of the dissemination of investment research we will not seek to take any advantage before providing it to our client. No representation or warranty is given as to the accuracy or completeness of this information and therefore it shouldn’t be relied upon as such. Any research provided does not have regard to specific financial situations, needs or investment objectives. Vantage accepts no responsibility for any use that may be made of these comments and for any consequences that result. Consequently, any person acting on it does so entirely at their own risk. We advise any readers of this material to seek professional advice where necessary. Without the approval of Vantage, reproduction or redistribution of this information isn’t permitted.
-

Open Trading Account
Discover the endless trading possibilities with our cutting-edge platform, designed to empower our traders. Practice trading the markets with a free demo account today.
-

Download Vantage App
Trade on the go with the Vantage All-In-One Trading App, where smooth execution and market access come together in the palm of your hand.
-

Start Trading
Are you an existing user? Login to your account to start trading 1,000+ CFD products including forex, indices, gold, shares and more.
